

Question: Refer to the computer solution to fiigure 3.18. a) Interpret the ranges of optimality for the objective function coefficients: b) Suppose that the manufacturing cost
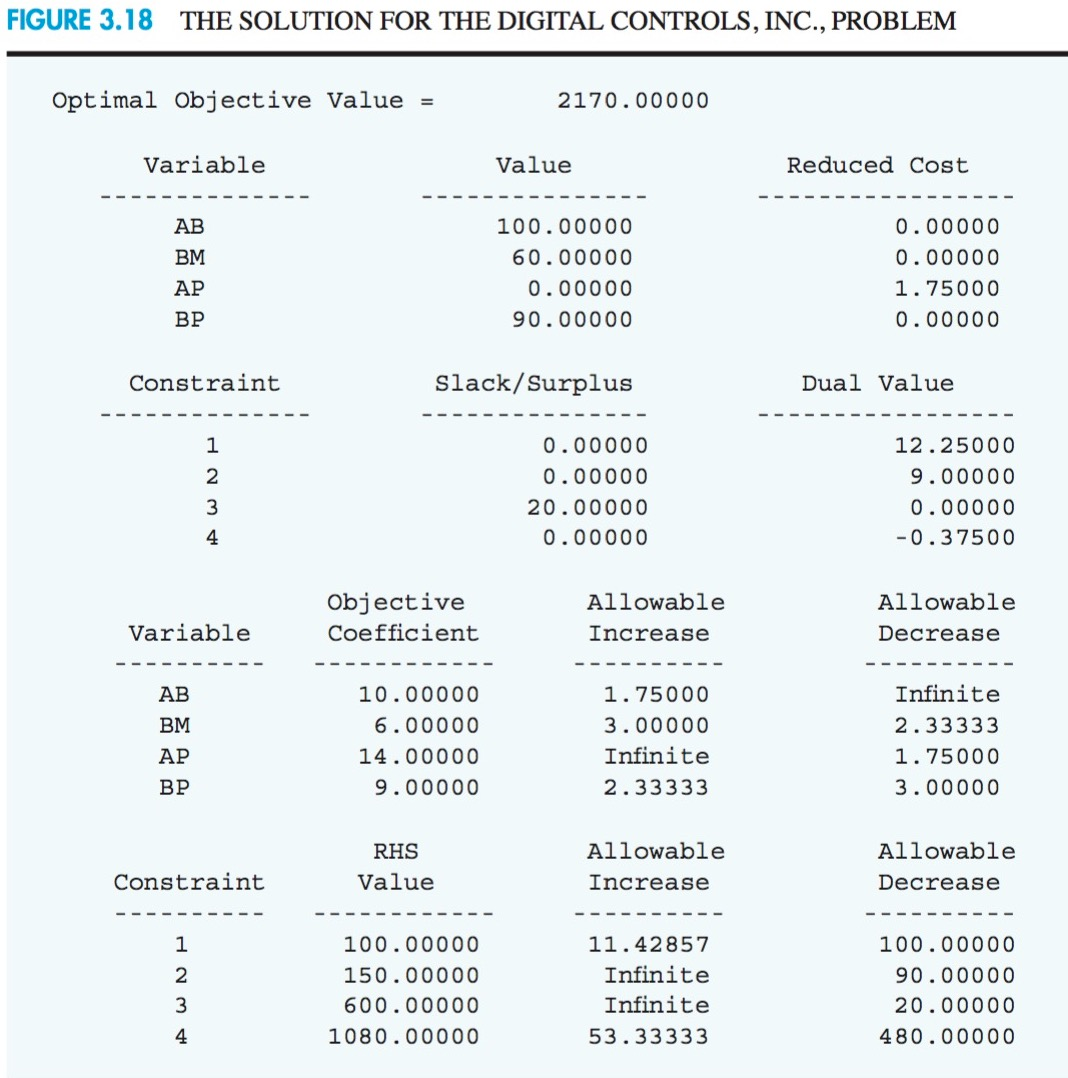
Refer to the computer solution to fiigure 3.18.
a) Interpret the ranges of optimality for the objective function coefficients:
b) Suppose that the manufacturing cost increases to $11.20 per case for model A. What is the new optimal solution?
c) Suppose that the manufacturing cost increases to $11.20 per case for model A and the manufacturing cost for model B decreases to $5 per unit. Would the optimal solution change?
Step by Step Solution
There are 3 Steps involved in it
1 Expert Approved Answer
Step: 1 Unlock

Question Has Been Solved by an Expert!
Get step-by-step solutions from verified subject matter experts
Step: 2 Unlock
Step: 3 Unlock