

Question: Refer to the data for 2019 below to answer the following questions: The Equivalence of Expenditure and Income (in Billions of Dollars) Expenditure C:
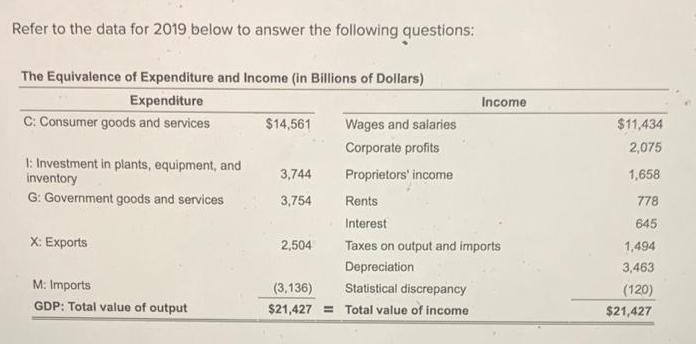

Refer to the data for 2019 below to answer the following questions: The Equivalence of Expenditure and Income (in Billions of Dollars) Expenditure C: Consumer goods and services 1: Investment in plants, equipment, and inventory G: Government goods and services X: Exports M: Imports GDP: Total value of output $14,561 3,744 3,754 2,504 (3,136) $21,427 Wages and salaries Corporate profits Proprietors' income Income Rents Interest Taxes on output and imports Depreciation Statistical discrepancy Total value of income $11,434 2,075 1,658 778 645 1,494 3,463 (120) $21,427 What share of U.S. total income in 2019 consisted of a. Taxes on output and imports? b. Rents? % %
Step by Step Solution
3.45 Rating (155 Votes )
There are 3 Steps involved in it
To calculate the share of US total income for taxes on output and impo... View full answer

Get step-by-step solutions from verified subject matter experts