

Question: Refer to the data set in the Q2 spreadsheet, which shows monthly demand for the ABC corporation. a) Forecast the monthly demand for Year 6
Refer to the data set in the Q2 spreadsheet, which shows monthly demand for the ABC corporation.
a) Forecast the monthly demand for Year 6 using the trend projection only. Report your forecast. (2 pts) What are the values of MAD, MAPE, MSE, and TS? (4 pts)
b) Forecast the monthly demand for Year 6 using the trend & seasonality adjustment. Report your forecast. (8 pts) What are the seasonal factors for each month? (4 pts) What are the values of MAD, MAPE, MSE, and TS? (4 pts)
c) Based on your analysis, should you consider the seasonality in the forecast? Why or why not? (4 pts)
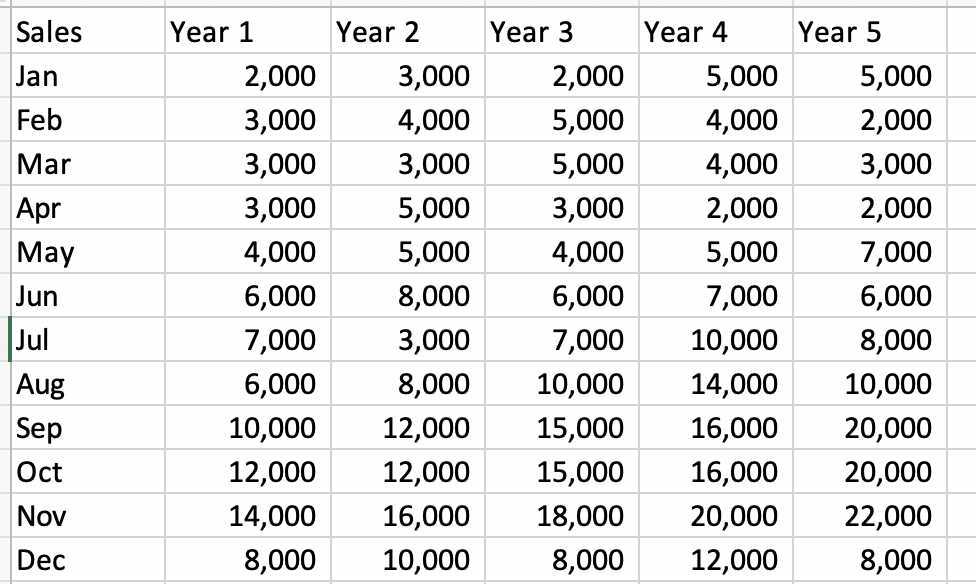
\begin{tabular}{|l|r|r|r|r|r|} \hline Sales & Year 1 & Year 2 & Year 3 & Year 4 & Year 5 \\ \hline Jan & 2,000 & 3,000 & 2,000 & 5,000 & 5,000 \\ \hline Feb & 3,000 & 4,000 & 5,000 & 4,000 & 2,000 \\ \hline Mar & 3,000 & 3,000 & 5,000 & 4,000 & 3,000 \\ \hline Apr & 3,000 & 5,000 & 3,000 & 2,000 & 2,000 \\ \hline May & 4,000 & 5,000 & 4,000 & 5,000 & 7,000 \\ \hline Jun & 6,000 & 8,000 & 6,000 & 7,000 & 6,000 \\ \hline Jul & 7,000 & 3,000 & 7,000 & 10,000 & 8,000 \\ \hline Aug & 6,000 & 8,000 & 10,000 & 14,000 & 10,000 \\ \hline Sep & 10,000 & 12,000 & 15,000 & 16,000 & 20,000 \\ \hline Oct & 12,000 & 12,000 & 15,000 & 16,000 & 20,000 \\ \hline Nov & 14,000 & 16,000 & 18,000 & 20,000 & 22,000 \\ \hline Dec & 8,000 & 10,000 & 8,000 & 12,000 & 8,000 \\ \hline \end{tabular}
Step by Step Solution
There are 3 Steps involved in it

Get step-by-step solutions from verified subject matter experts