

Question: Refer to the data table in Question 9 at the end of Chapter 5 in your textbook. Answer the following questions: 1. Compute the average
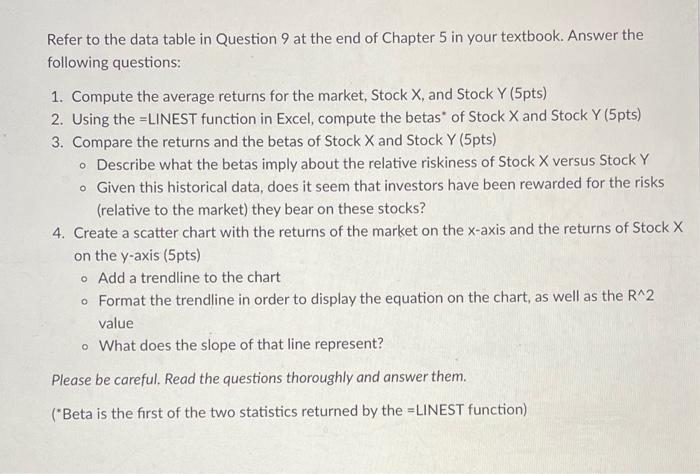
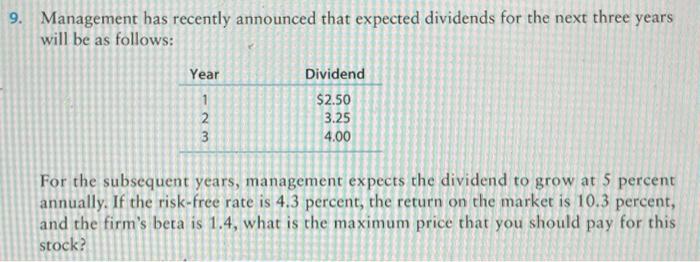
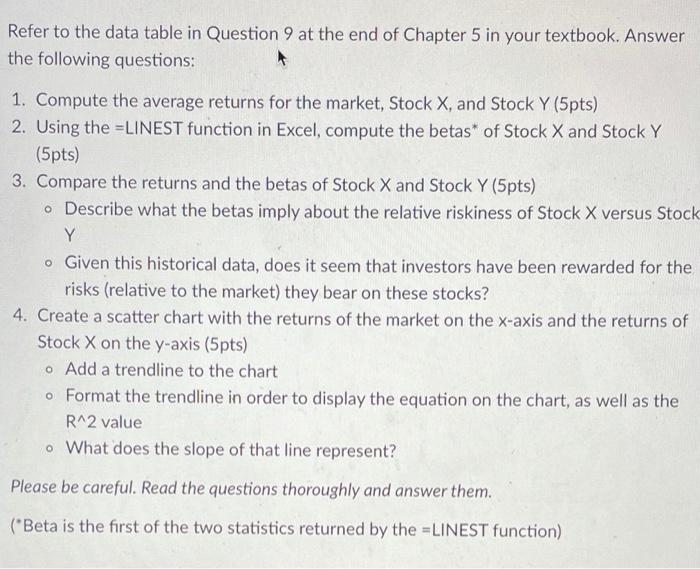
Refer to the data table in Question 9 at the end of Chapter 5 in your textbook. Answer the following questions: 1. Compute the average returns for the market, Stock X, and Stock Y (5pts) 2. Using the ELINEST function in Excel, compute the betas" of Stock X and Stock Y (5pts) 3. Compare the returns and the betas of Stock X and Stock Y (5pts) Describe what the betas imply about the relative riskiness of Stock X versus Stock Y . Given this historical data, does it seem that investors have been rewarded for the risks (relative to the market) they bear on these stocks? 4. Create a scatter chart with the returns of the market on the x-axis and the returns of Stock X on the y-axis (5pts) Add a trendline to the chart o Format the trendline in order to display the equation on the chart, as well as the R^2 value o What does the slope of that line represent? Please be careful, Read the questions thoroughly and answer them. ("Beta is the first of the two statistics returned by the ELINEST function) 9. Management has recently announced that expected dividends for the next three years will be as follows: Year 1 2 3 Dividend $2.50 3.25 4.00 For the subsequent years, management expects the dividend to grow at 5 percent annually. If the risk-free rate is 4.3 percent, the return on the market is 10.3 percent, and the firm's beta is 1.4, what is the maximum price that you should pay for this stock? Refer to the data table in Question 9 at the end of Chapter 5 in your textbook. Answer the following questions: 1. Compute the average returns for the market, Stock X, and Stock Y (5pts) 2. Using the =LINEST function in Excel, compute the betas* of Stock X and Stock Y (5pts) 3. Compare the returns and the betas of Stock X and Stock Y (5pts) Describe what the betas imply about the relative riskiness of Stock X versus Stock Y . Given this historical data, does it seem that investors have been rewarded for the risks (relative to the market) they bear on these stocks? 4. Create a scatter chart with the returns of the market on the x-axis and the returns of Stock X on the y-axis (5pts) o Add a trendline to the chart . Format the trendline in order to display the equation on the chart, as well as the R^2 value o What does the slope of that line represent? Please be careful. Read the questions thoroughly and answer them. ("Beta is the first of the two statistics returned by the =LINEST function)
Step by Step Solution
There are 3 Steps involved in it

Get step-by-step solutions from verified subject matter experts