

Question: Refer to the following case study, answer questions given. CASE STUDY U.S. Presidential Election From the document Official Presidential General Election Results published by the
Refer to the following case study, answer questions given.
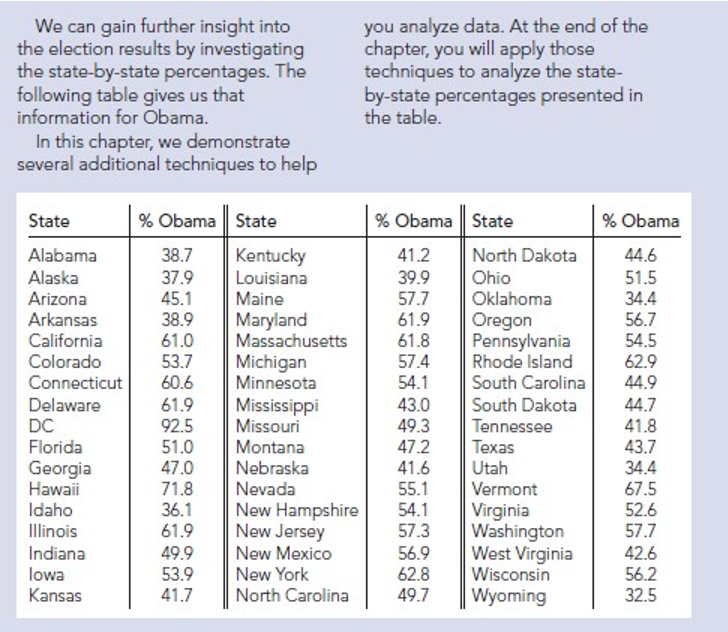
CASE STUDY U.S. Presidential Election From the document Official Presidential General Election Results published by the Federal Election Commission, we found final results of a the 2008 U.S. presidential election. Barack Obama received 365 electoral votes versus 173 electoral votes obtained by John Mccain. Thus, the Obama and Mccain electoral vote percentages were 67.8% and 32.2%, respectively. From a popular vote perspective, the election was much closer: Obama got 69,456,897 votes and Mccain received 59,934,814 votes. Taking into account that the total popular vote for all candidates was 131,257,328, we see that the Obama and Mccain popular vote percentages were 52.9% and 45.7%, respectively.We can gain further insight into you analyze data. At the end of the the election results by investigating chapter, you will apply those the state-by-state percentages. The techniques to analyze the state- following table gives us that by-state percentages presented in information for Obama. the table. In this chapter, we demonstrate several additional techniques to help State % Obama State % Obama State % Obama Alabama 38.7 Kentucky 41.2 North Dakota 44.6 Alaska 37.9 Louisiana 39.9 Ohio 51.5 Arizona 45.1 Maine 57.7 Oklahoma 34.4 Arkansas 38.9 Maryland 61.9 Oregon 56.7 California 61.0 Massachusetts 61.8 Pennsylvania 54.5 Colorado 53.7 Michigan 57.4 Rhode Island 62.9 Connecticut 60.6 Minnesota 54.1 South Carolina 44.9 Delaware 61.9 Mississippi 43.0 South Dakota 44.7 DC 92.5 Missouri 49.3 Tennessee 41.8 Florida 51.0 Montana 47.2 Texas 43.7 Georgia 47.0 Nebraska 41.6 Utah 34.4 Hawaii 71.8 Nevada 55.1 Vermont 67.5 Idaho 36.1 New Hampshire 54.1 Virginia 52.6 Illinois 61.9 New Jersey 57.3 Washington 57.7 Indiana 49.9 New Mexico 56.9 West Virginia 42.6 lowa 53.9 New York 62.8 Wisconsin 56.2 Kansas 41.7 North Carolina 49.7 Wyoming 32.5
Step by Step Solution
There are 3 Steps involved in it

Get step-by-step solutions from verified subject matter experts