

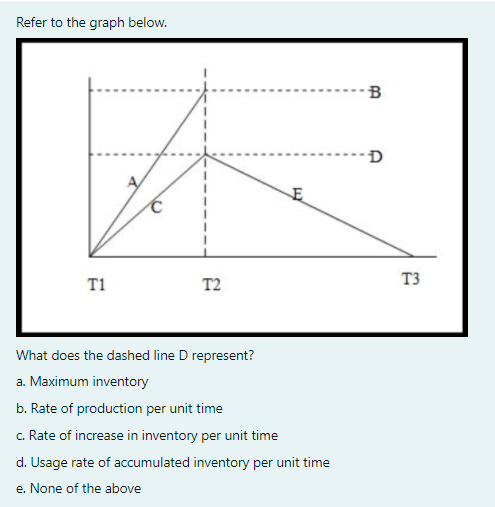
Question: Refer to the graph below. B D E T3 T1 T2 What does the dashed line D represent? a. Maximum inventory b. Rate of production
Step by Step Solution
There are 3 Steps involved in it
1 Expert Approved Answer
Step: 1 Unlock

Question Has Been Solved by an Expert!
Get step-by-step solutions from verified subject matter experts
Step: 2 Unlock
Step: 3 Unlock