

Question: Refer to the graph below. With which curve does the opportunity cost of an additional unit of good Y decrease as more units of good
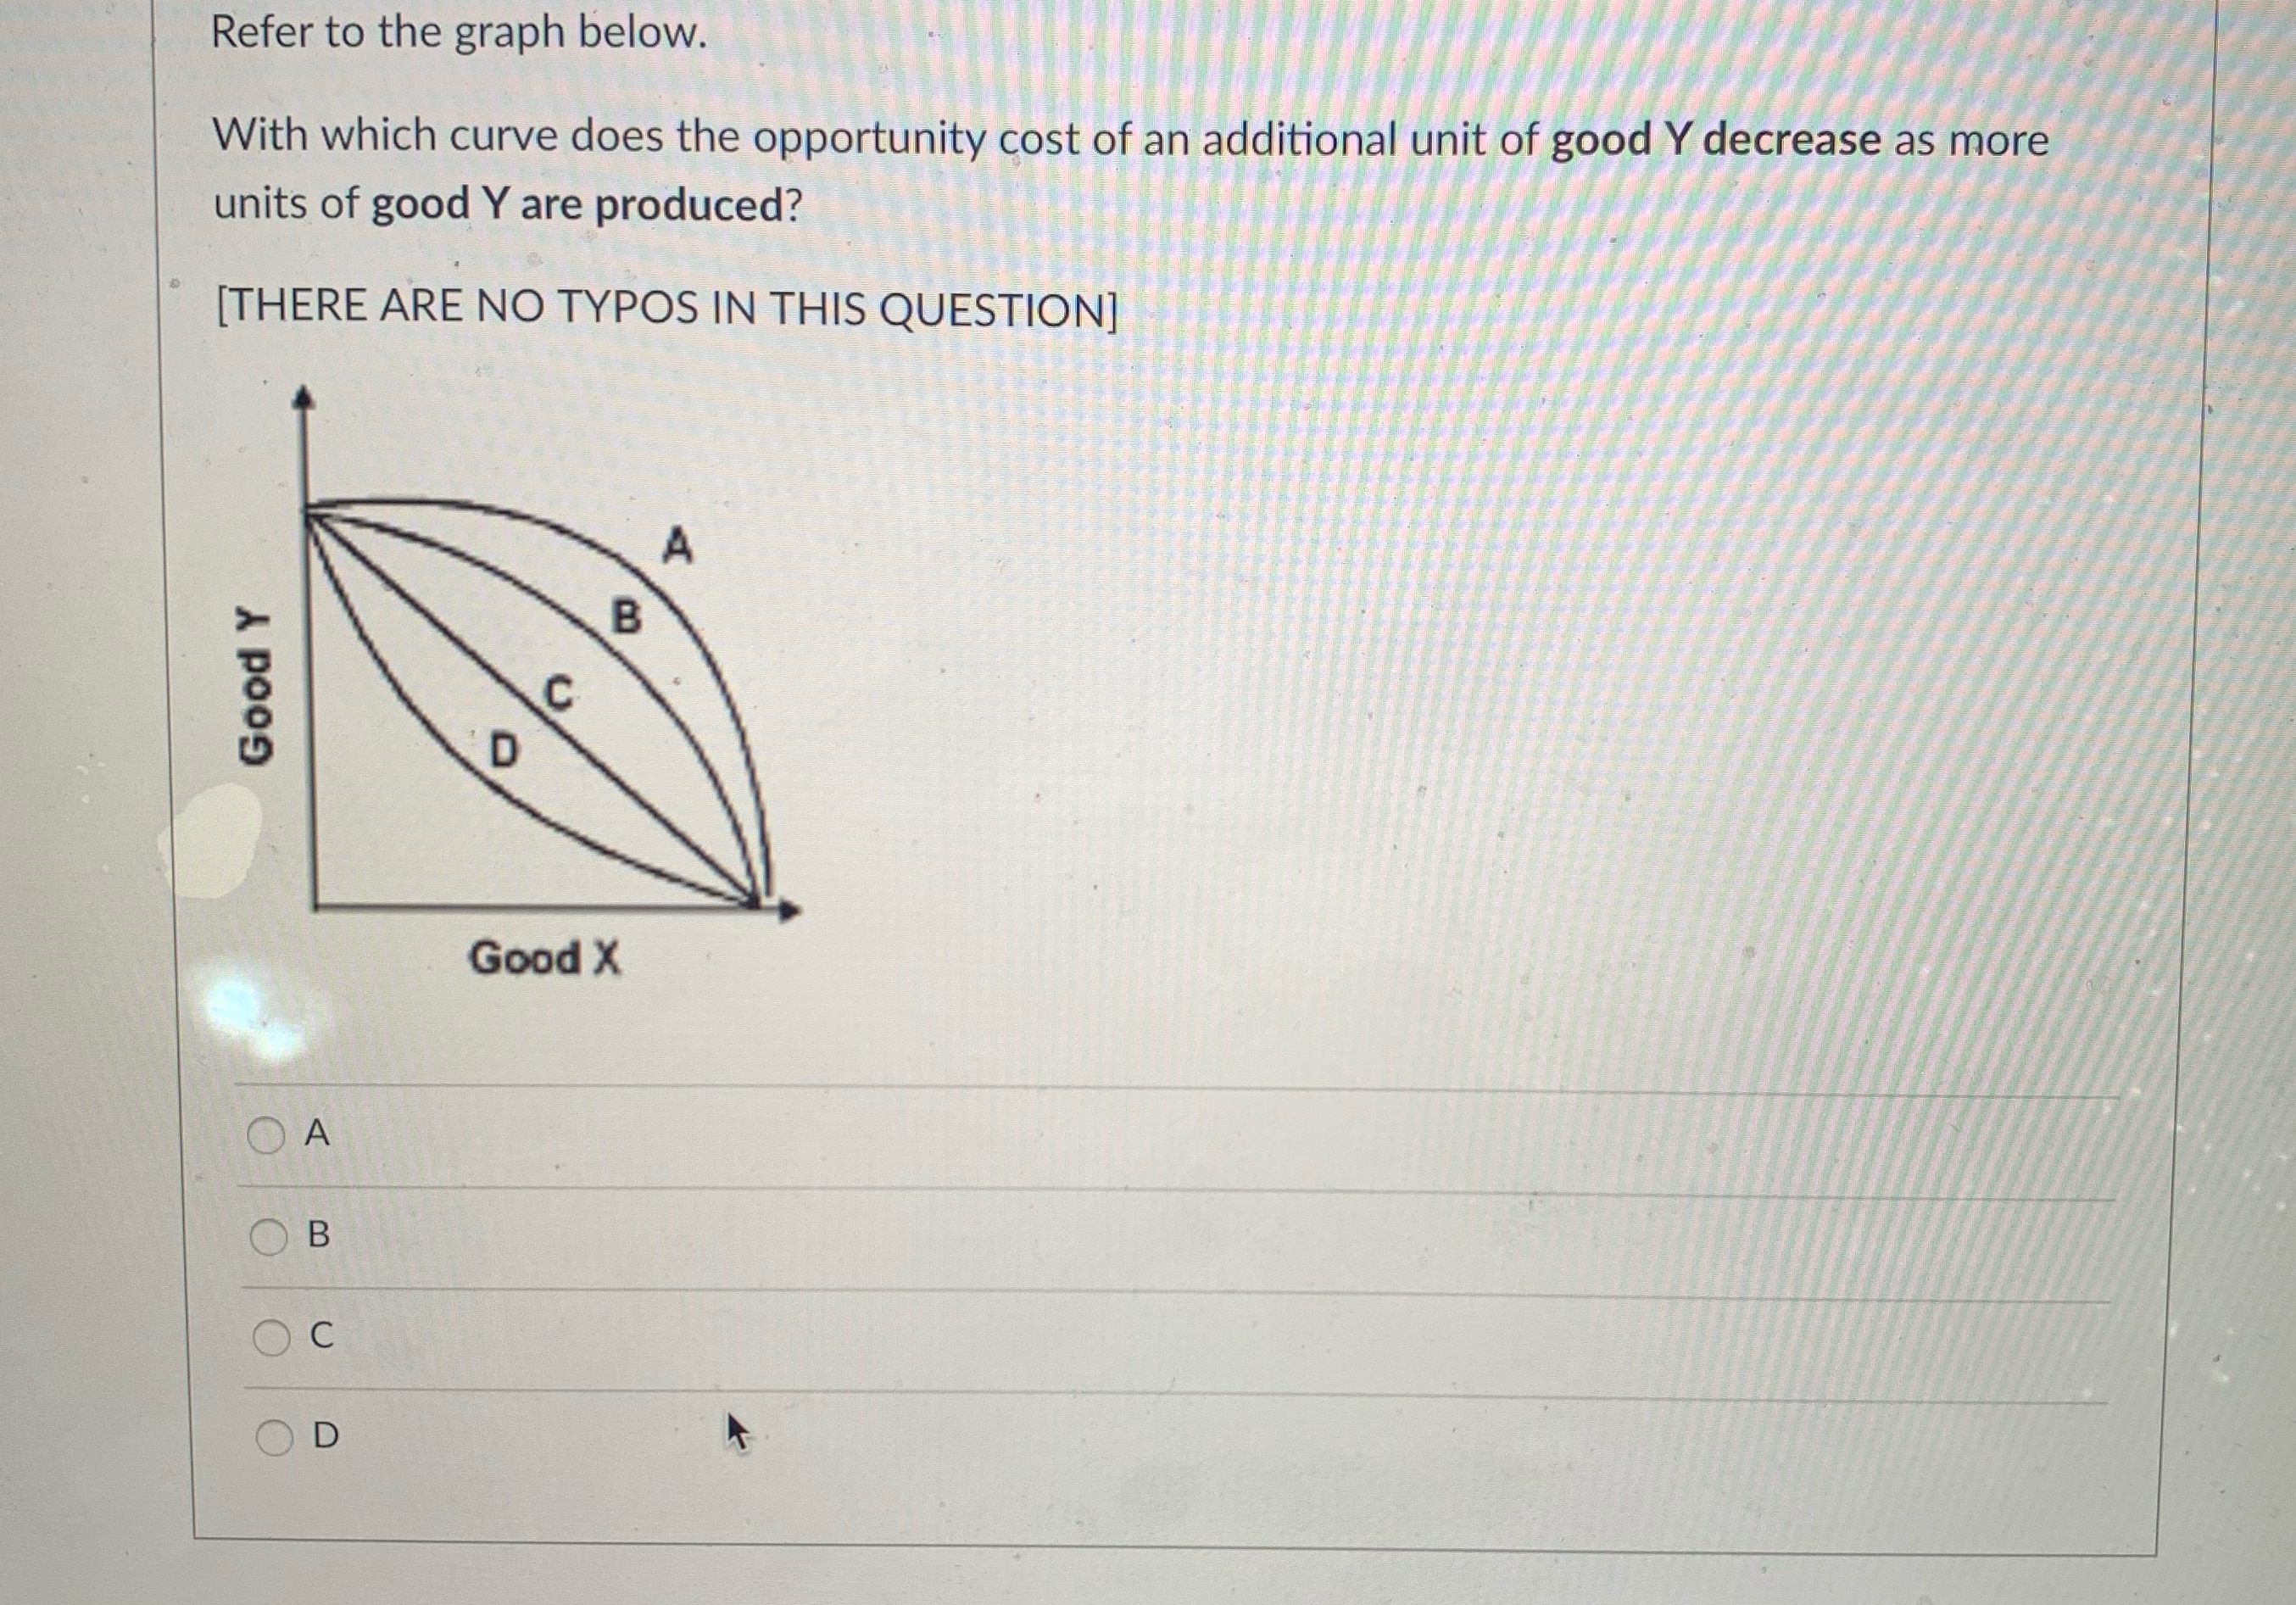

Refer to the graph below. With which curve does the opportunity cost of an additional unit of good Y decrease as more units of good Y are produced? [THERE ARE NO TYPOS IN THIS QUESTION] B Good Y C D Good X OA O B OC OD
Step by Step Solution
There are 3 Steps involved in it
1 Expert Approved Answer
Step: 1 Unlock

Question Has Been Solved by an Expert!
Get step-by-step solutions from verified subject matter experts
Step: 2 Unlock
Step: 3 Unlock