

Question: Refer to the graphs below. The first graph shows the money market of an economy, and the second graph shows the market for goods and
Refer to the graphs below. The first graph shows the money market of an economy, and the second graph shows the market for goods and services in the economy.
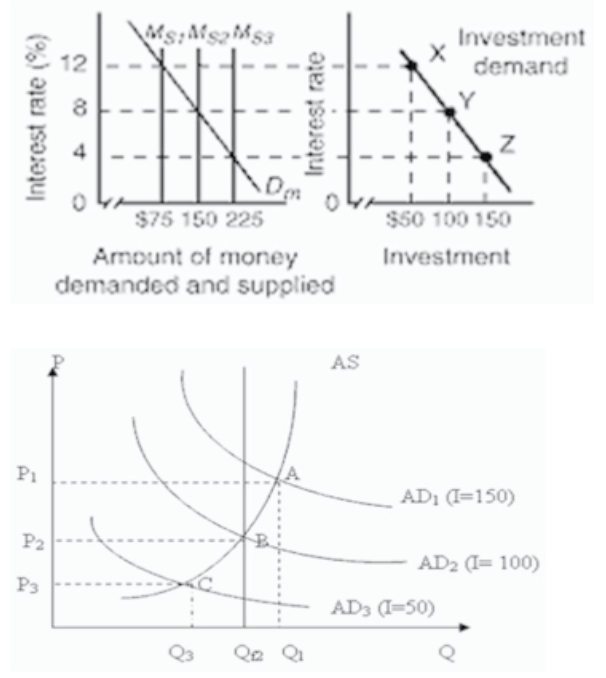
Ms; MisaM 53 12 X Investment demand Y 8 Interest rate Interest rate (%) 4 Z $75 150 225 $50 100 150 Amount of money Investment demanded and supplied AS P1 A AD, (I=150) P2 B AD2 (I= 100) P3 AD3 (1=50) Q3
Step by Step Solution
There are 3 Steps involved in it
1 Expert Approved Answer
Step: 1 Unlock

Question Has Been Solved by an Expert!
Get step-by-step solutions from verified subject matter experts
Step: 2 Unlock
Step: 3 Unlock