

Question: Refer to the graphs. Suppose the Graph A represents a typical firm's supply curve in a perfectly competitive industry, and there are 1 0 0
Refer to the graphs. Suppose the Graph A represents a typical firm's supply curve in a perfectly competitive industry, and there are identical firms in the industry. What does Graph B represent?
A the average total cost curve for the industry
B the individual demand curve facing each firm in the industry
C the market supply curve
D the individual supply curve for each firm in the industry
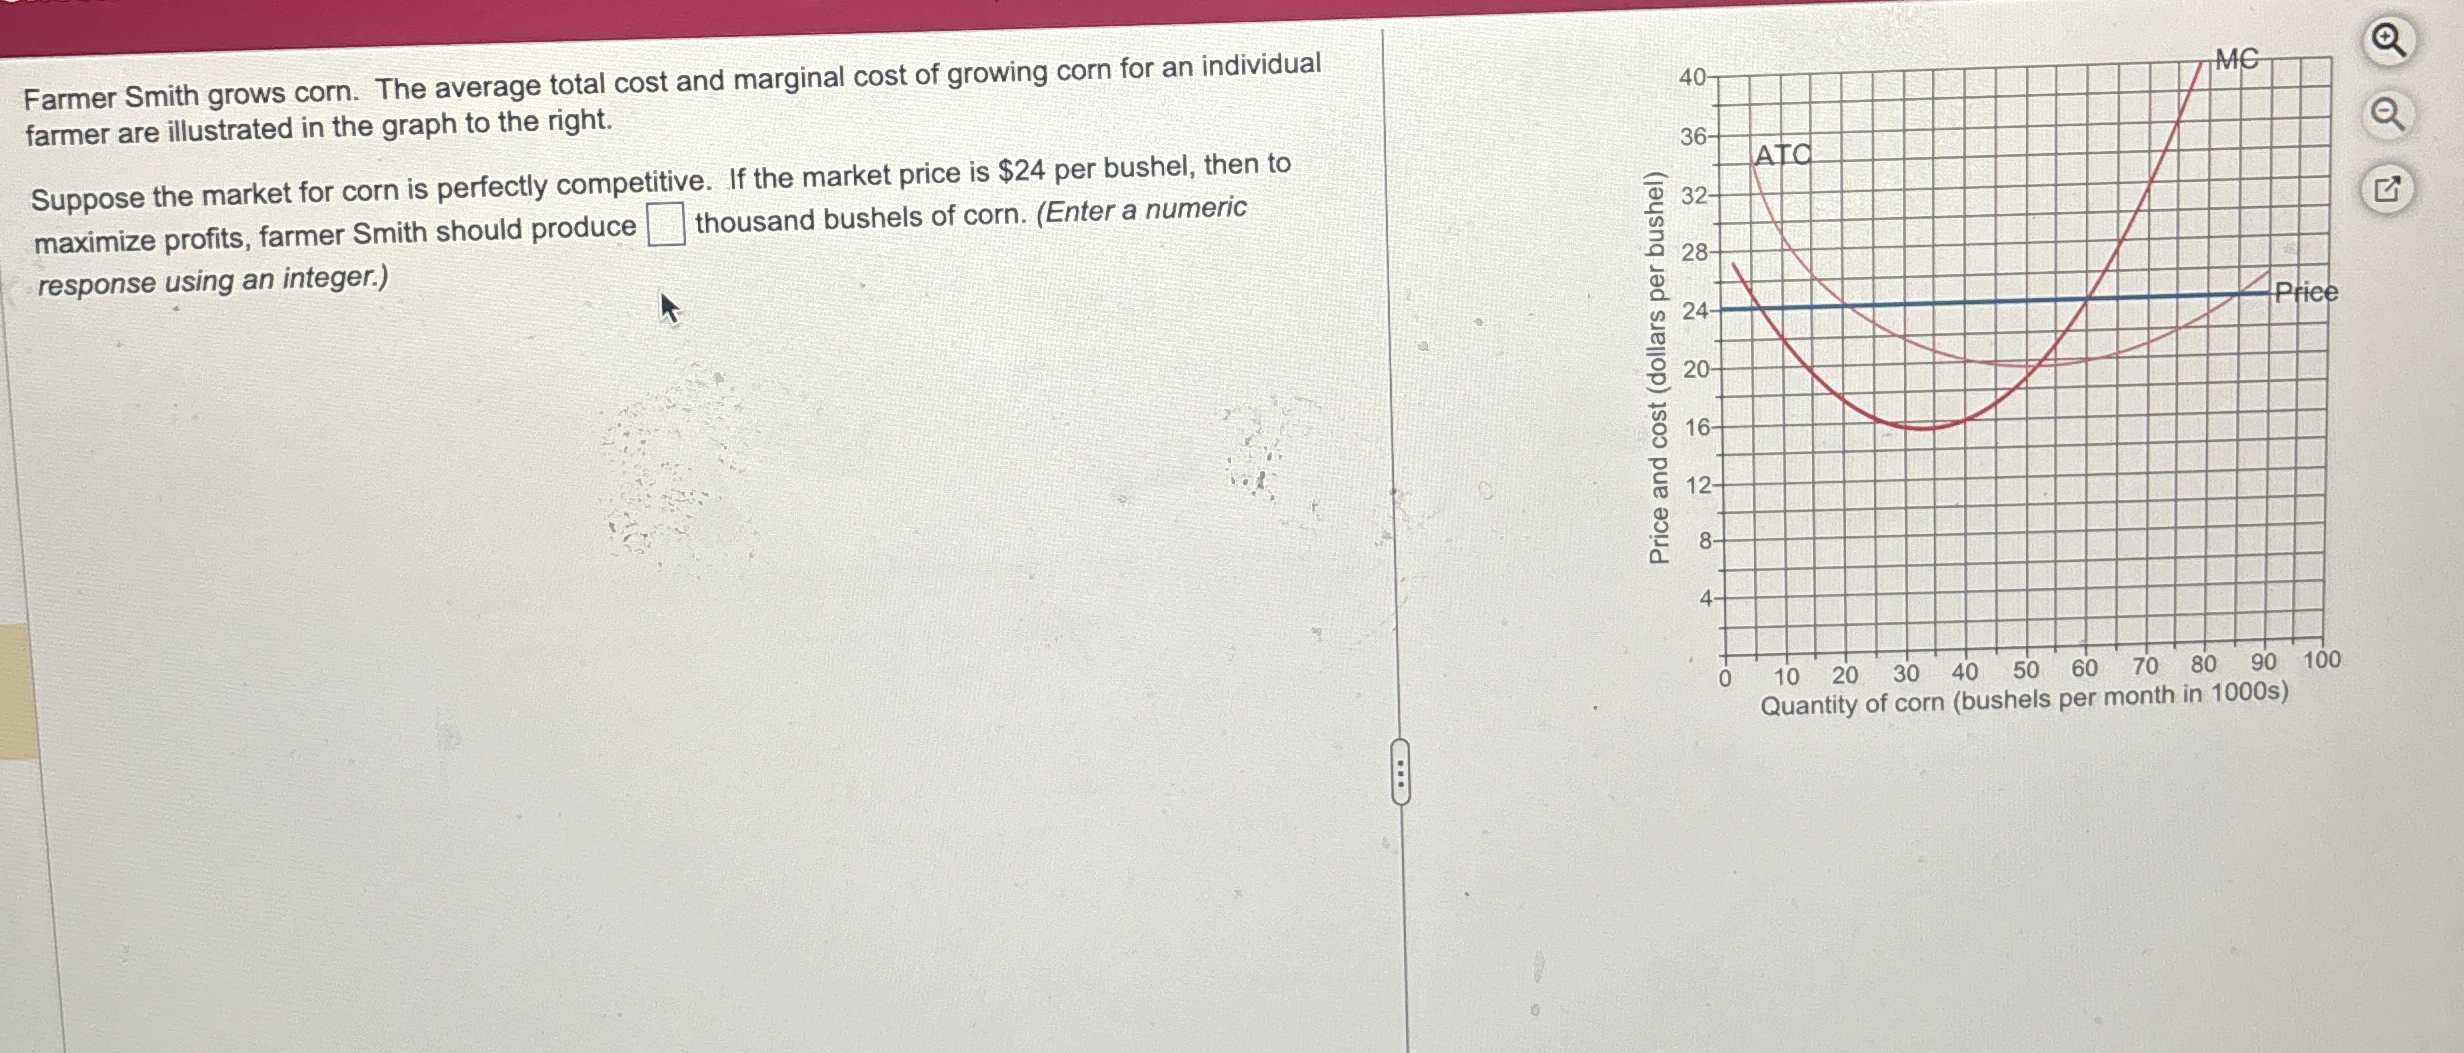
Farmer Smith grows corn. The average total cost and marginal cost of growing corn for an individual farmer are illustrated in the graph to the right.
Suppose the market for corn is perfectly competitive. If the market price is $ per bushel, then to maximize profits, farmer Smith should produce thousand bushels of corn. Enter a numeric response using an integer.
Step by Step Solution
There are 3 Steps involved in it
1 Expert Approved Answer
Step: 1 Unlock

Question Has Been Solved by an Expert!
Get step-by-step solutions from verified subject matter experts
Step: 2 Unlock
Step: 3 Unlock