

Question: Refer to the information shown in the table below. Each column in the table represents the depreciation values for a different depreciation method. Which
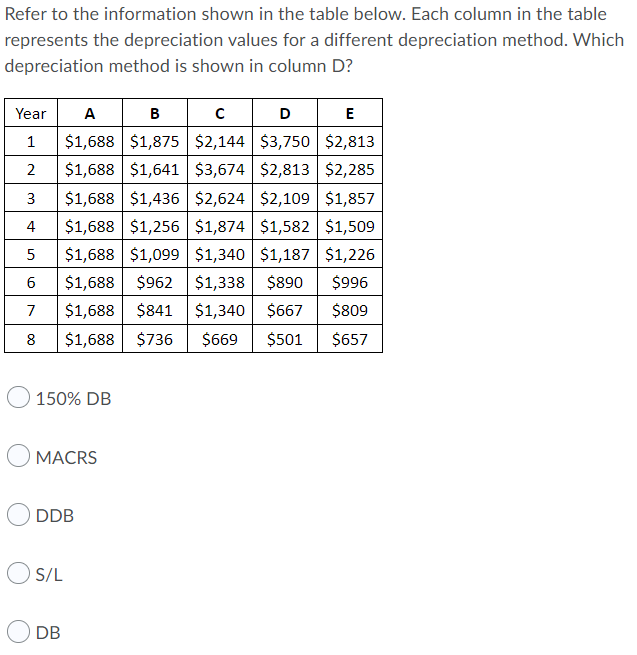
Refer to the information shown in the table below. Each column in the table represents the depreciation values for a different depreciation method. Which depreciation method is shown in column D? Year A B D E 1 $1,688 $1,875 $2,144 $3,750 $2,813 2 $1,688 $1,641 $3,674 $2,813 $2,285 3 $1,688 $1,436 $2,624 $2,109 $1,857 4 $1,688 $1,256 $1,874 $1,582 $1,509 5 $1,688 $1,099 $1,340 $1,187 $1,226 6 $1,688 $962 $1,338 $890 $996 7 $1,688 $841 $1,340 $667 $809 8 $1,688 $736 $669 $501 $657 150% DB MACRS DDB S/L DB
Step by Step Solution
There are 3 Steps involved in it
1 Expert Approved Answer
Step: 1 Unlock

Question Has Been Solved by an Expert!
Get step-by-step solutions from verified subject matter experts
Step: 2 Unlock
Step: 3 Unlock