

Question: Refer to the ratio analysis example in the lesson (Figures 3.13.3) and update these ratios for Amazon, Sears, and eBay based on their 2015, 2016,
Refer to the ratio analysis example in the lesson (Figures 3.13.3) and update these ratios for Amazon, Sears, and eBay based on their 2015, 2016, and 2017 annual reports. Review other applicable areas of the annual report, such as the footnotes and MD&A and tell us what the results mean in your own words. What do you think could explain the changes?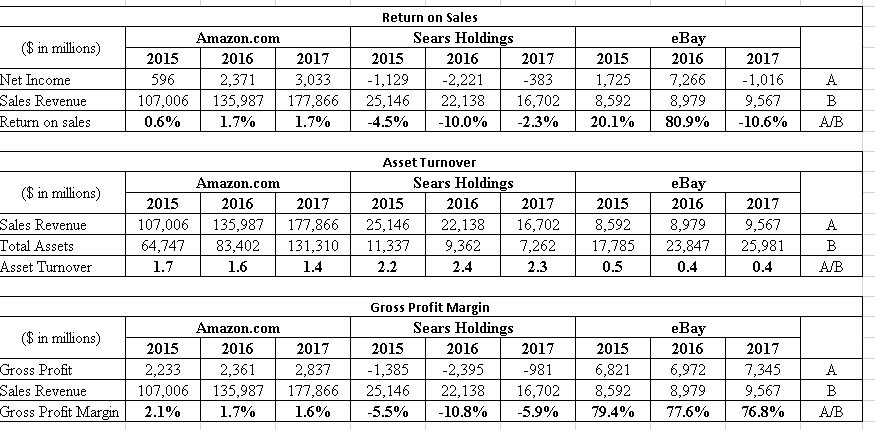 I entered the results from the annual reports in this chart.
($ in millions) Amazon.com 2015 2016 596 2,371 107,006 135,987 0.6% 1.7% Net Income Sales Revenue Return on sales Return on Sales Sears Holdings 2015 2016 2017 -1,129 -2,221 -383 25,146 22,138 16,702 -4.5% -10.0% -2.3% 2017 3,033 177,866 1.7% 2015 1,725 8,592 20.1% eBay 2016 7,266 8,979 80.9% 2017 -1,016 9,567 -10.6% A B A/B ($ in millions) Amazon.com 2015 2016 2017 107,006 135,987 177,866 64,747 83,402 131,310 1.7 1.6 1.4 Asset Turnover Sears Holdings 2015 2016 2017 25,146 22,138 16,702 11,337 9,362 7,262 2.4 Sales Revenue Total Assets Asset Turnover 2015 8,592 17,785 eBay 2016 8,979 23,847 0.4 2017 9,567 25,981 0.4 A B A/B 2.2 2.3 0.5 ($ in millions) Amazon.com 2015 2016 2017 2,233 2,361 2,837 107,006 135,987 177,866 2.1% 1.7% 1.6% Gross Profit Margin Sears Holdings 2015 2016 2017 -1,385 -2,395 -981 25,146 22,138 16,702 -5.5% -10.8% -5.9% Gross Profit Sales Revenue Gross Profit Margin 2015 6,821 8,592 79.4% eBay 2016 6,972 8,979 77.6% 2017 7,345 9,567 76.8% A B A/B
Step by Step Solution
There are 3 Steps involved in it

Get step-by-step solutions from verified subject matter experts