

Question: Refer to the table below: Expected return, E(R) Standard deviation, a Correlation 3 Doors, Inc. 16% 31 .16 Down Co 8% 15 Using the information
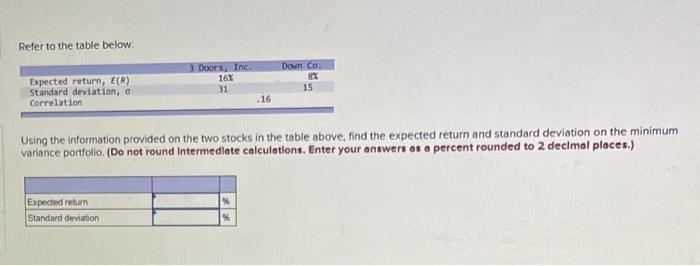
Refer to the table below: Expected return, E(R) Standard deviation, a Correlation 3 Doors, Inc. 16% 31 .16 Down Co 8% 15 Using the information provided on the two stocks in the table above, find the expected return and standard deviation on the minimum variance portfolio. (Do not round Intermediate calculations. Enter your answers as a percent rounded to 2 decimal places.) Expected return Standard deviation
Step by Step Solution
There are 3 Steps involved in it
1 Expert Approved Answer
Step: 1 Unlock

Question Has Been Solved by an Expert!
Get step-by-step solutions from verified subject matter experts
Step: 2 Unlock
Step: 3 Unlock