

Question: Refer to the table Factors for Computing. Control Chart Limits ( 3 sigma) for this problem. The overall average of a process you are attempting
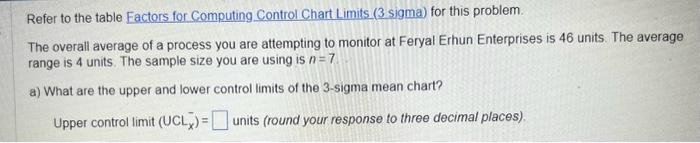
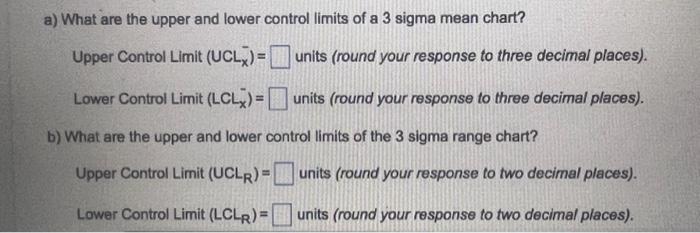
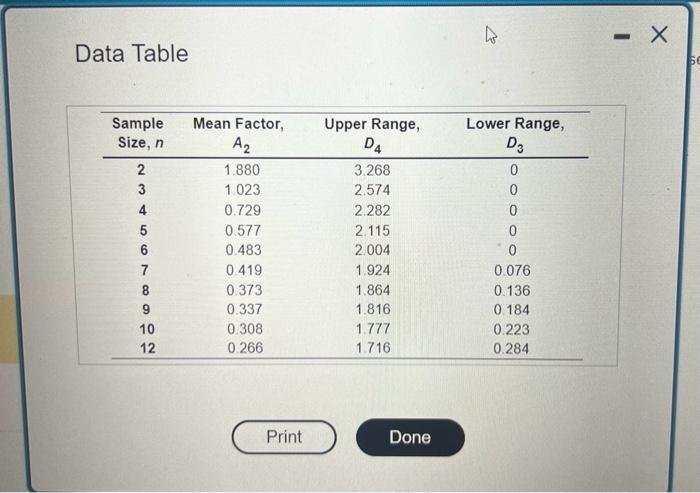
Refer to the table Factors for Computing. Control Chart Limits ( 3 sigma) for this problem. The overall average of a process you are attempting to monitor at Feryal Erhun Enterprises is 46 units. The average range is 4 units. The sample size you are using is n=7 a) What are the upper and lower control limits of the 3-sigma mean chart? Upper control limit (UCLx)=units (round your response to three decimal places). Data Table a) What are the upper and lower control limits of a 3 sigma mean chart? Upper Control Limit (UCLx)= units (round your response to three decimal places). Lower Control Limit (LCLx)= units (round your response to three decimal places). b) What are the upper and lower control limits of the 3 sigma range chart? Upper Control Limit (UCLR)= units (round your response to two decimal places). Lower Control Limit (LCLR)= units (round your response to two decimal places)
Step by Step Solution
There are 3 Steps involved in it

Get step-by-step solutions from verified subject matter experts