

Question: Refer to the table Factors for Computing Control Chart Limits (3 sigma) for this problem. A process at Amit Eynan Bottling Company that is
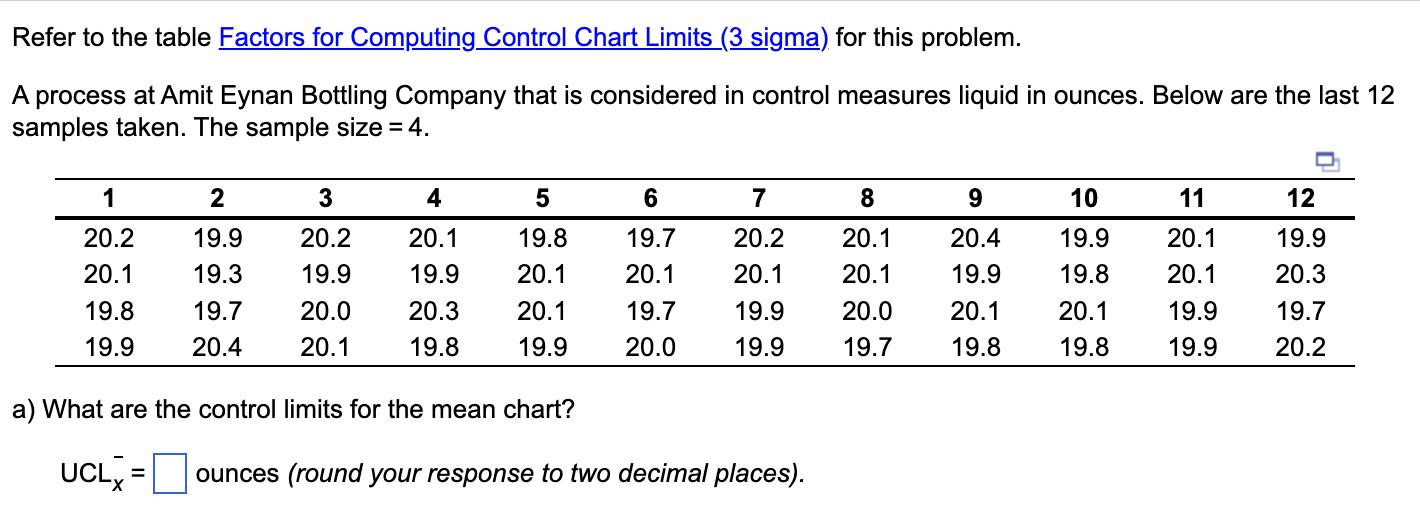
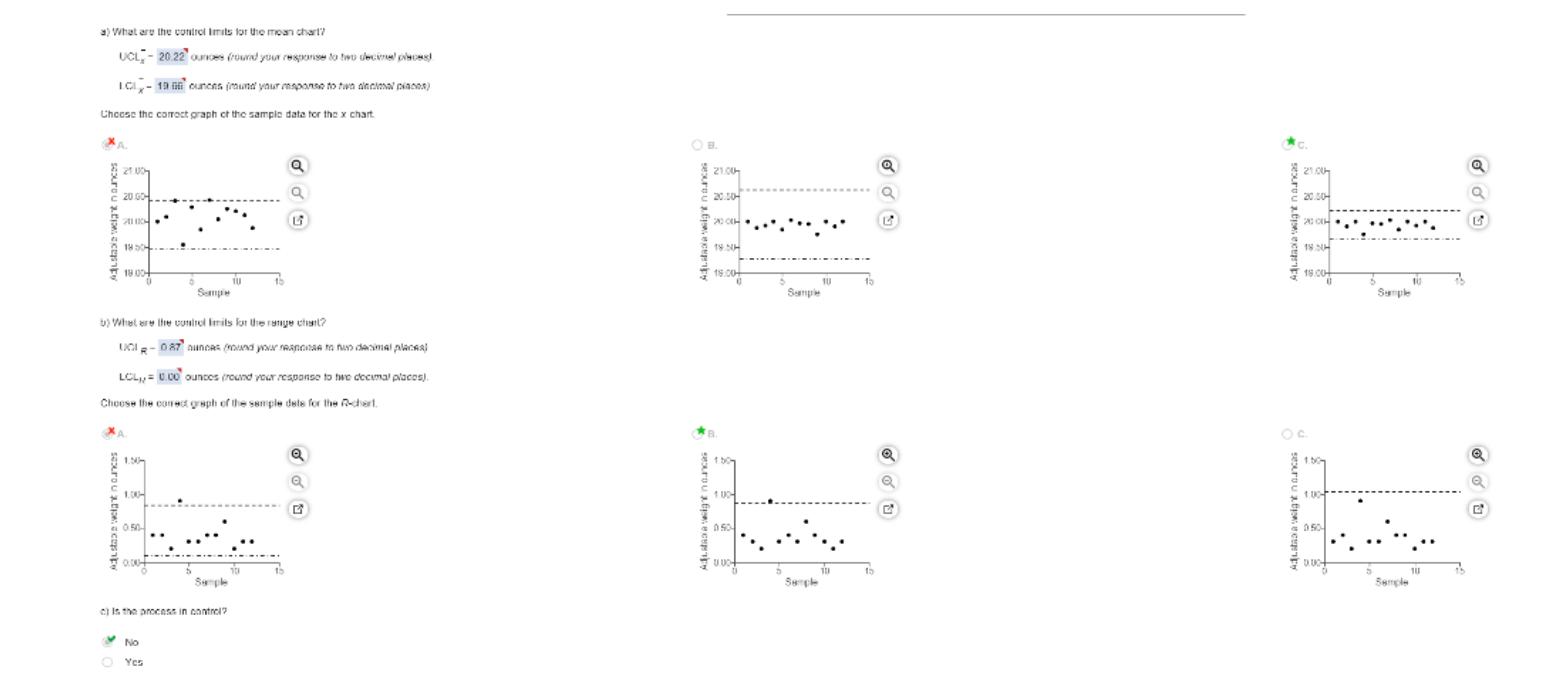
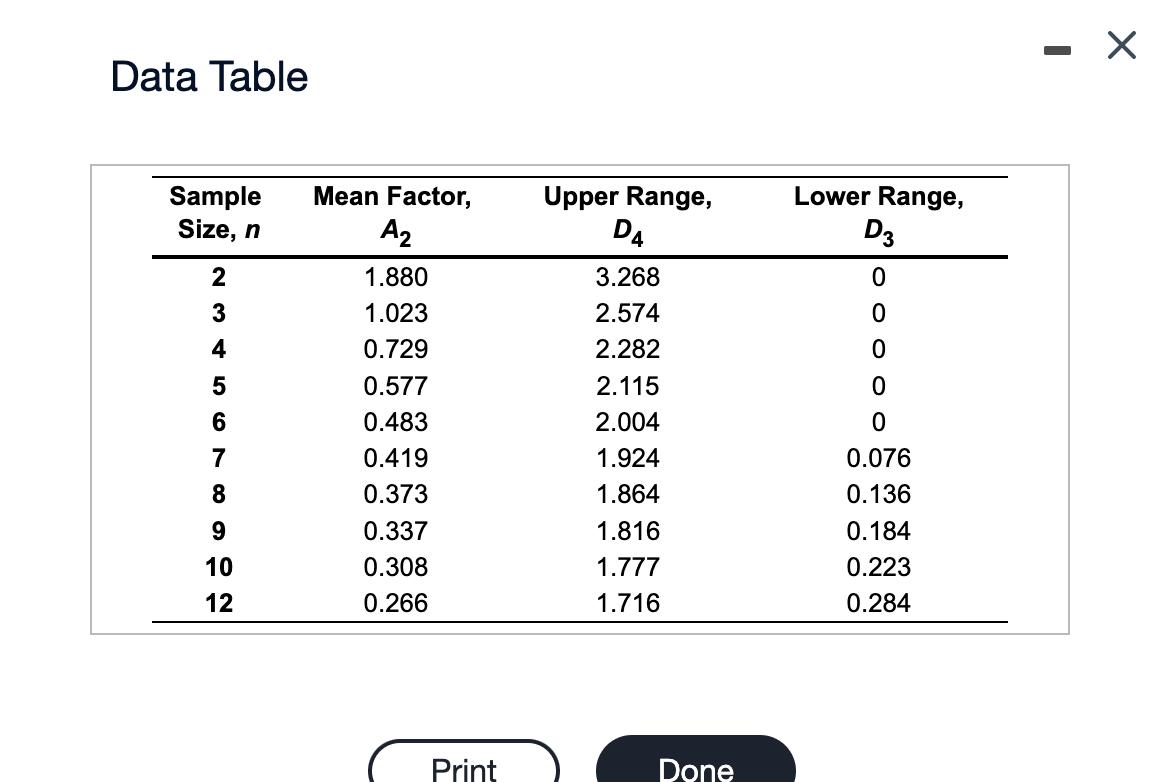
Refer to the table Factors for Computing Control Chart Limits (3 sigma) for this problem. A process at Amit Eynan Bottling Company that is considered in control measures liquid in ounces. Below are the last 12 samples taken. The sample size = 4. 1 20.2 20.1 19.8 19.9 2 19.9 19.3 19.7 20.4 3 4 20.2 20.1 19.9 19.9 20.0 20.3 20.1 19.8 5 19.8 20.1 20.1 19.9 a) What are the control limits for the mean chart? UCLX 6 19.7 20.1 19.7 20.0 7 20.2 20.1 19.9 19.9 = ounces (round your response to two decimal places). 8 20.1 20.1 20.0 20.1 19.7 19.8 9 20.4 19.9 10 19.9 19.8 20.1 19.8 11 20.1 20.1 19.9 19.9 12 19.9 20.3 19.7 20.2 a) What are the control Imits for the mean chart? UCL-20 22 ounces (round your response to two decimal places! LC-196 ounces (mund your maponse to two decimal picos) Choose the correct graph ct the sample date for the x chart X 21.00- c20.00- 2104 1850- 18.00+ 1.00 Sempe 050- b) What are the control limits for the range chant? UGIR-0.87 unor (round your response to tus decimal places) LCL,= 0.00 ounces (round your response to two decimal places) Choose the correct graph of the sample dets for the Rechert. Sample TU c) is the process in control? No O Yes G 101 Q 21.00 20.00 200 18.50 NH 18.00+ 8 1.00 100- 050- 0.00+ Sample Semple 10 101 15 21.00 20.00 V 200 18 H sexro 18.00 1:00- 050- 0.00 U Sample Semple 10 10 U Data Table Sample Size, n 2 3 4 5 6 7 8 9 10 12 Mean Factor, A2 1.880 1.023 0.729 0.577 0.483 0.419 0.373 0.337 0.308 0.266 Print Upper Range, D4 3.268 2.574 2.282 2.115 2.004 1.924 1.864 1.816 1.777 1.716 Done Lower Range, D3 0 0 0 0 0 0.076 0.136 0.184 0.223 0.284 X Refer to the table Factors for Computing Control Chart Limits (3 sigma) for this problem. A process at Amit Eynan Bottling Company that is considered in control measures liquid in ounces. Below are the last 12 samples taken. The sample size = 4. 1 20.2 20.1 19.8 19.9 2 19.9 19.3 19.7 20.4 3 4 20.2 20.1 19.9 19.9 20.0 20.3 20.1 19.8 5 19.8 20.1 20.1 19.9 a) What are the control limits for the mean chart? UCLX 6 19.7 20.1 19.7 20.0 7 20.2 20.1 19.9 19.9 = ounces (round your response to two decimal places). 8 20.1 20.1 20.0 20.1 19.7 19.8 9 20.4 19.9 10 19.9 19.8 20.1 19.8 11 20.1 20.1 19.9 19.9 12 19.9 20.3 19.7 20.2 a) What are the control Imits for the mean chart? UCL-20 22 ounces (round your response to two decimal places! LC-196 ounces (mund your maponse to twa diecimal pincos) Choose the correct graph ct the sample date for the x chart X 21.00- c20.00- 2104 1850- 18.00+ 1.00 Sempe 050- b) What are the control limits for the range chant? UGIR-87 uno (round your response to tus decimal places) LCL,= 0.00 ounces (round your response to two decimal places) Choose the correct graph of the sample dets for the Rechert. Sample TU c) is the process in control? No O Yes G 101 Q 21.00 20.00 200 18.50 NH 18.00+ 8 1.00 100- 050- 0.00+ Sample Semple 10 101 15 21.00 20.00 V 200 18 H sexro 18.00 1:00- 050- 0.00 U Sample Semple 10 10 U Data Table Sample Size, n 2 3 4 5 6 7 8 9 10 12 Mean Factor, A2 1.880 1.023 0.729 0.577 0.483 0.419 0.373 0.337 0.308 0.266 Print Upper Range, D4 3.268 2.574 2.282 2.115 2.004 1.924 1.864 1.816 1.777 1.716 Done Lower Range, D3 0 0 0 0 0 0.076 0.136 0.184 0.223 0.284 X
Step by Step Solution
There are 3 Steps involved in it
To determine the control limits for the mean chart we will first have to calculate the mean of the m... View full answer

Get step-by-step solutions from verified subject matter experts