

Refer to the table. The unit sales of two brands (denoted by 1 and 2) have been
Question:
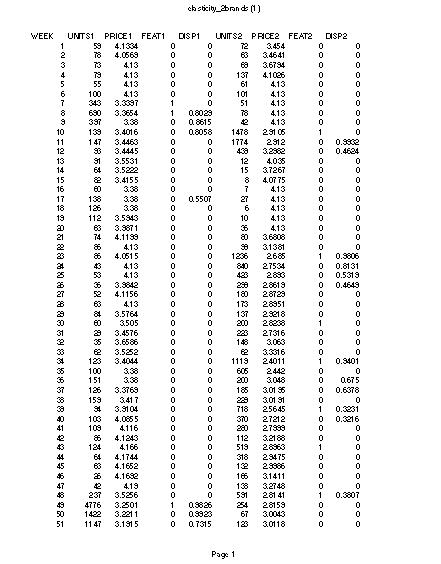
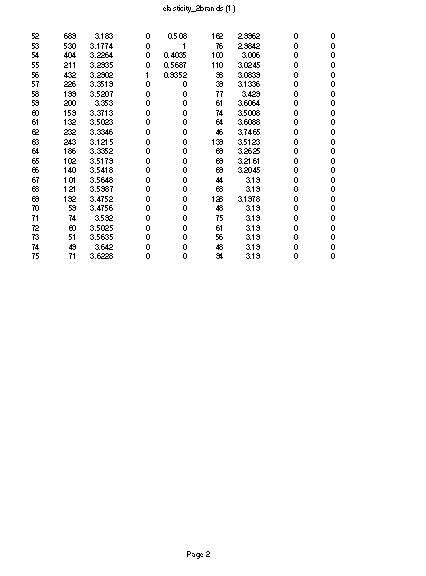
Refer to the table. The unit sales of two brands (denoted by 1 and 2) have been summed up across several stores, whereas marketing activity variables are weighted averages across those stores. The data set contains the following variables: Week = Week number (1 to 75) Unitsj = Total units of brand “j” sold (j=1 to 2) across stores Pricej = Shelf price of brand “j” (weighted average across stores) Featj = Newspaper feature, (1 = brand "j" is featured, 0 = otherwise) Dispj = Weighted average of in In-store display, (1 = there is an in-store display for brand "j" in a store, 0 = otherwise) Using the data, calculate the own price elasticity of two brands. Explain in detail the model that you used and the steps that you follow. Please copy and paste Excel output, if any. What are the managerial implications that one can infer from your results?
Expert Answer:
Regression Analysis r 0396 75 0629 k 1 Std Error 0718 Dep Var LnUNITS1 ANOVA ... View the full answer


College Mathematics for Business Economics Life Sciences and Social Sciences
ISBN: 978-0321614001
12th edition
Authors: Raymond A. Barnett, Michael R. Ziegler, Karl E. Byleen
