

Question: reference: Develop and run a Simulink program to stimulate the dynamic response of the thermometer when, at tim to 0.5 min, it is plunged the
reference:
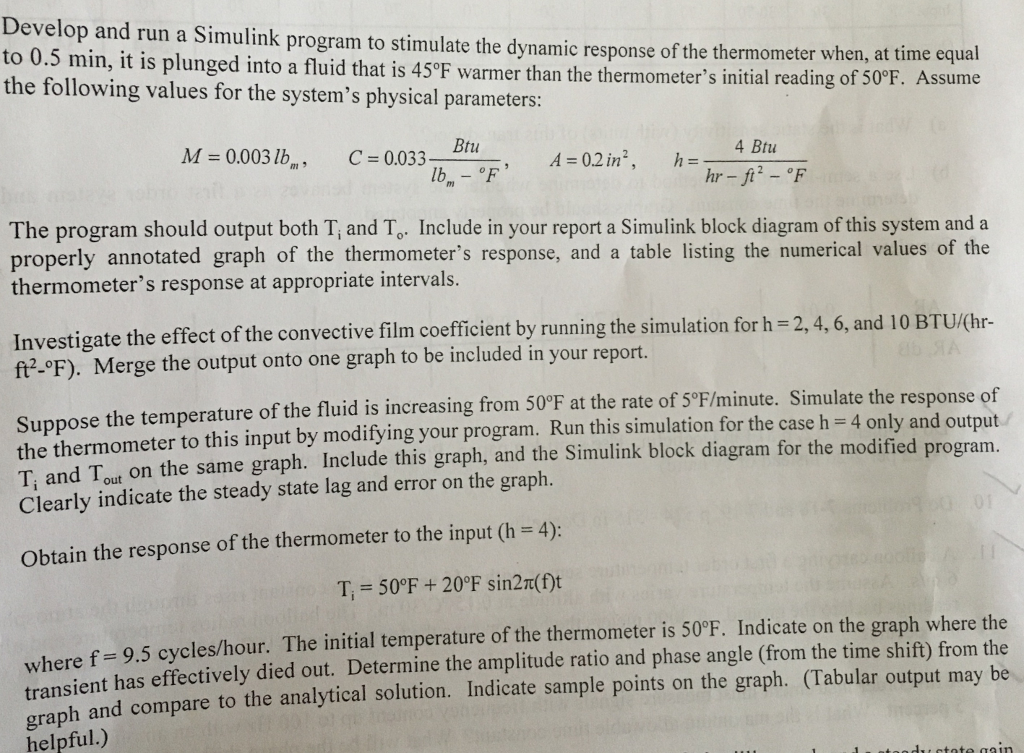
Develop and run a Simulink program to stimulate the dynamic response of the thermometer when, at tim to 0.5 min, it is plunged the following values for the system's physical parameters: e equal nto a fluid that is 45F warmer than the thermometer's initial reading of 50F. Assume M=0.003 Ibm, C=0.033 Btu A=02 in", 4 Btu h= Ib The program should output both T, and To. Include in your report a Simulink block diagram of this system and a properly annotated graph of the thermometer's response, and a table listing the numerical values of the thermometer's response at appropriate intervals Investigate the effect of the convective film coefficient by running the simulation for h 2,4,6, and 10 BTU/(hr ft2-F). Merge the output onto one graph to be included in your report Suppose the temperature of the fluid is increasing from 50F at the rate of 50F minute. Simulate the response of the thermometer to this input by modifying your program. Run this simulation for the case h 4 only and output T, and Tout on the same graph. Include this graph, and the Simulink block diagram for the modified program Clearly indicate the steady state lag and error on the graph. Obtain the response of the thermometer to the input (h 4) T, 50F+20F sin2(f)t where f-9.5 cycles/hour. The initial temperature of the thermometer is 50F. Indicate on the graph where the transient has effectively died out. Determine the amplitude ratio and phase angle (from the time shift) from the graph and compare to the analytical solution. Indicate sample points on the graph. (Tabular output may be helpful.) Develop and run a Simulink program to stimulate the dynamic response of the thermometer when, at tim to 0.5 min, it is plunged the following values for the system's physical parameters: e equal nto a fluid that is 45F warmer than the thermometer's initial reading of 50F. Assume M=0.003 Ibm, C=0.033 Btu A=02 in", 4 Btu h= Ib The program should output both T, and To. Include in your report a Simulink block diagram of this system and a properly annotated graph of the thermometer's response, and a table listing the numerical values of the thermometer's response at appropriate intervals Investigate the effect of the convective film coefficient by running the simulation for h 2,4,6, and 10 BTU/(hr ft2-F). Merge the output onto one graph to be included in your report Suppose the temperature of the fluid is increasing from 50F at the rate of 50F minute. Simulate the response of the thermometer to this input by modifying your program. Run this simulation for the case h 4 only and output T, and Tout on the same graph. Include this graph, and the Simulink block diagram for the modified program Clearly indicate the steady state lag and error on the graph. Obtain the response of the thermometer to the input (h 4) T, 50F+20F sin2(f)t where f-9.5 cycles/hour. The initial temperature of the thermometer is 50F. Indicate on the graph where the transient has effectively died out. Determine the amplitude ratio and phase angle (from the time shift) from the graph and compare to the analytical solution. Indicate sample points on the graph. (Tabular output may be helpful.)
Step by Step Solution
There are 3 Steps involved in it

Get step-by-step solutions from verified subject matter experts