

Question: Reference: histretSP 1928-2021.pdf Determine an asset allocation using bootstrapping and solver methodologies. Refer to the yearly returns on Stocks, Bills and Bonds for 1928-2021. Assume
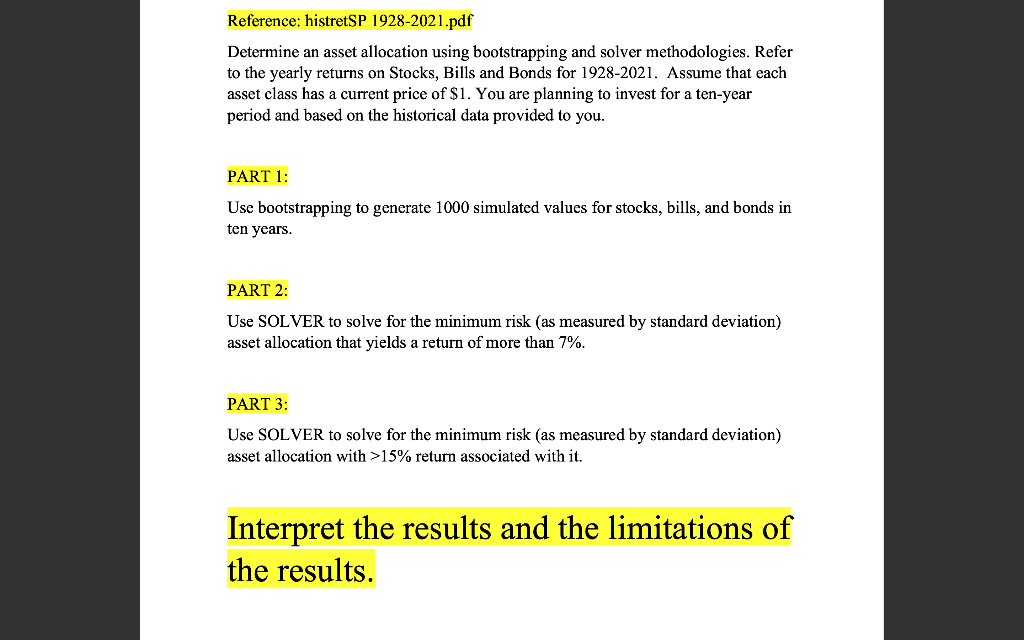
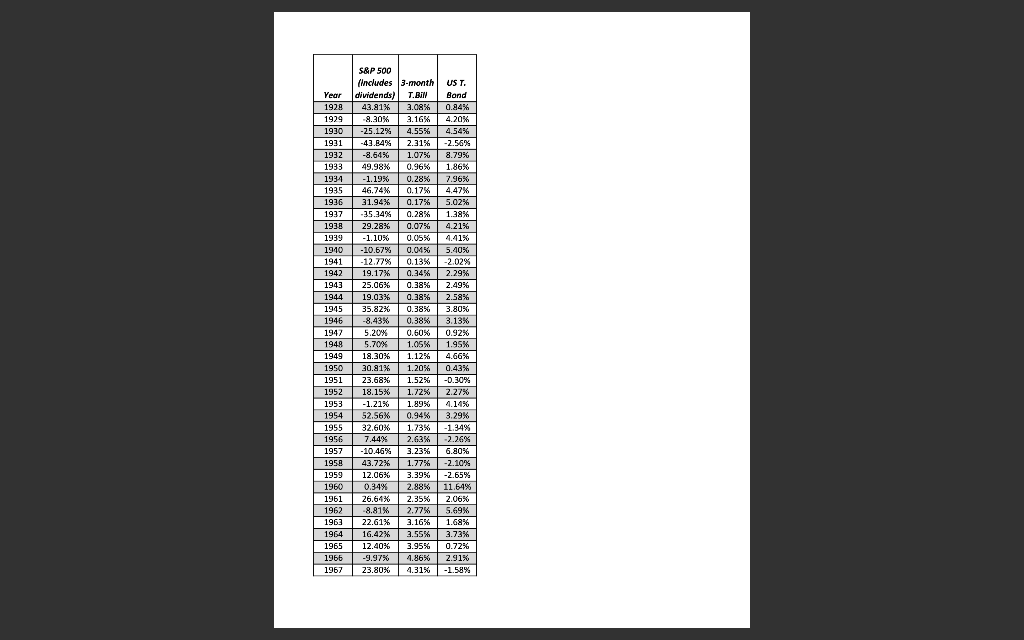
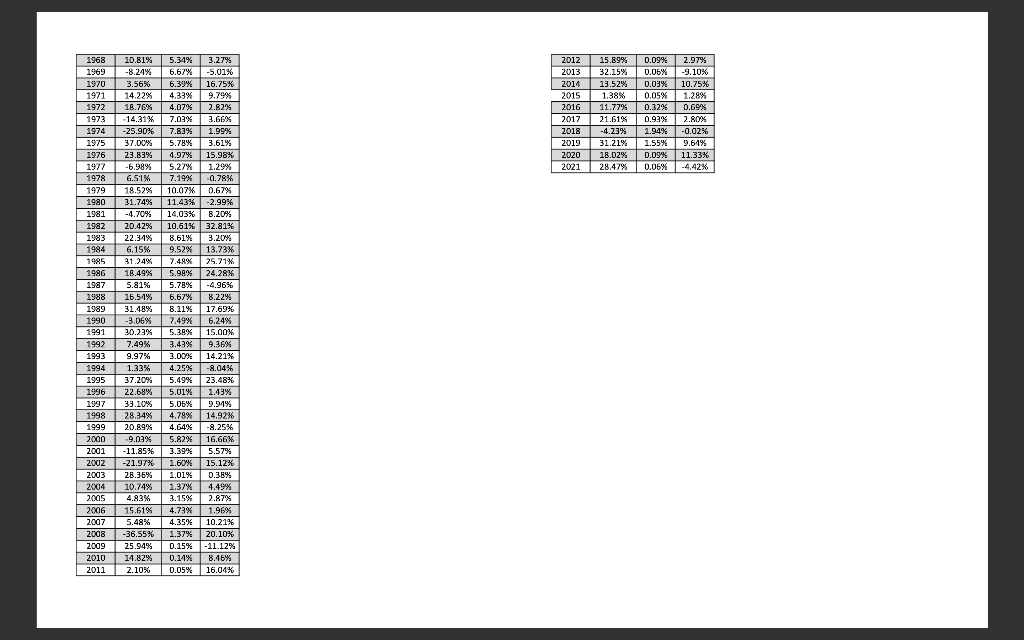
Reference: histretSP 1928-2021.pdf Determine an asset allocation using bootstrapping and solver methodologies. Refer to the yearly returns on Stocks, Bills and Bonds for 1928-2021. Assume that each asset class has a current price of $1. You are planning to invest for a ten-year period and based on the historical data provided to you. PART 1: Use bootstrapping to generate 1000 simulated values for stocks, bills, and bonds in ten years. PART 2: Use SOLVER to solve for the minimum risk (as measured by standard deviation) asset allocation that yields a return of more than 7%. PART 3: Use SOLVER to solve for the minimum risk (as measured by standard deviation) asset allocation with >15% return associated with it. Interpret the results and the limitations of the results. S&P 500 SP includes 3-ronth US T. Year dividends) T.BIN Bond 1928 43.81% 3.08% % 0.84% % 1929 -8.30% 3.16% 4.20% 1930 -25.12% 4.55% 4.54% % % 1931 -43.84% 2.31% -2.56% 1932 -8,64% 1.07% 8.79% % 1933 49.98% 0.96% 1.86% 1934 - 1.19% 0.28% 7.96% 1935 46.74% 0.17% 4.47% 1936 31.94% 0.17% 5.02% 1937 -35.34% 0.28% 1.38% 1938 29.28% 0.07% 4.21% % % 1939 -1.10% 0.05% 4.41% 1940 -10.67% 0.045 5.40% 1941 -12.72% 0.13% -2.02% 1942 19.17% 0.34% 2.29% 1943 25.06% 0.38% 2.49% 1944 19.03% 0.38% 2.58% % 1945 35.82% 0.38% 3.80% 1946 -8.43% 0.38% % 3.13% 1947 5.20% 0.60% 0.92% 1948 5.70% 1.05% 1.95% 1949 18.30% 1.12% 4.66% 1950 30.81% 1.20% 0.43% % 1951 23.68% 1.52% -0.30% 1952 18.15% 1.72% 2.27% 1953 -1.21% 1.89% % % 4.14% 1954 52.56% 0.94% 3.29% 1955 32.60% 1.73% -1.34% 1956 7.44% 2.63% -2.26% 1957 -10.46% 3.23% 6.80% 1958 43.72% 1.77% -2.10% 1959 12.06% 3.39% -2.65% % 1960 0.34% 2.88% 11.64% 1961 26.64% 2.35% 2.06% 1962 -8.81% 2.77% 5.69% % 1963 22.61% 3.16% 1.68% 1964 16.42% 3.55% 3.73% % % 1965 12.40% 3.95% 0.72% 1966 -9.97% 4.86% 2.91% % 1967 23.80% 4.31% -1.58% % % LAT. 2012 15.89% 0.09% 2.97% % 2013 32.15% 0.06% -9.10% 2014 13.52% 0.03% 10.75% 2015 1.38% 0.05% 1.28% 2016 11.77% 0.32% 0.69% 2017 21.61% % 0.93% 2.80% 2018 -4.23% 1.94% -0.02% 2019 31.21% 1.55% 9.61% 2020 18.02% 0.09% 11.33% 2021 28.47% 0.06% -4.42% 1968 10.81% 5.34% 3.27% 1969 -8.24% 6.67% -5.01% % % 1970 3.56% 6.39% 16.75% 1971 14.22% 4.33% 9.79% 1972 18.76% 4.07% 2.82% 1973 14.31% 7.03% 3.66% 1974 -25.90% 7.83% 1.99% 1975 37.00% 5.789 3.61% 1976 23.83% 4.97% 15.98% 1977 -6.98% 5.27% 1.29% 1978 6.51% 7.19% -0.78% % 1979 18.52% 10.07% 0.67% 1980 31.74% 11.43% -2.99% % 1981 -4.70% 14.03% 8.20% 1982 20.42% 10.61% 32.81% 1983 22.31% 8.61% 3.20% 1984 6.15% % 9.52% 13.73% 1985 31.24% 7.48% 25.71% % 1986 18.49% 5.9AX 24.28% 1987 5.81% 5.78% -4.96% 1988 15.5.1% 6.67% 8.22% 1989 31.48% 8.11% 17.69% 1990 -3.06% 7.49% 6.24% 1991 30.23% 5.38% 15.00% 1992 7.49% 3.43% 9.36% 1993 9.97% 3.00% 14.21% 1994 1.33% 4.25% -8.04% % 1995 37.20% 5.49% 23.48% 1996 22.68% 5.01% 1.43% % 1997 33.10% 5.05% % 9.94% 1998 28.34% 4.78% 14.92% 1999 20.89% 4.64% -8.25% 2000 -9.02% 5.82% 16.66% 2001 -11.85% 3.39% 5.57% 2002 -21.97% 1.60% 15.12% 2003 28.36% 1.01% 0.38% 2004 10.74% 1.37% 4.49% 2005 4.83% 3.15% 2.87% 2006 15.61% 4.73% 1.96% 2007 5.48% 4.35% 10.21% 2008 -36.55% 1.37% 20.10% 2009 25.94% 0.15% -11.12% 2010 14.82% % 0.14% 8.46% % 2011 2.10% % 0.05% 16.04% Reference: histretSP 1928-2021.pdf Determine an asset allocation using bootstrapping and solver methodologies. Refer to the yearly returns on Stocks, Bills and Bonds for 1928-2021. Assume that each asset class has a current price of $1. You are planning to invest for a ten-year period and based on the historical data provided to you. PART 1: Use bootstrapping to generate 1000 simulated values for stocks, bills, and bonds in ten years. PART 2: Use SOLVER to solve for the minimum risk (as measured by standard deviation) asset allocation that yields a return of more than 7%. PART 3: Use SOLVER to solve for the minimum risk (as measured by standard deviation) asset allocation with >15% return associated with it. Interpret the results and the limitations of the results. S&P 500 SP includes 3-ronth US T. Year dividends) T.BIN Bond 1928 43.81% 3.08% % 0.84% % 1929 -8.30% 3.16% 4.20% 1930 -25.12% 4.55% 4.54% % % 1931 -43.84% 2.31% -2.56% 1932 -8,64% 1.07% 8.79% % 1933 49.98% 0.96% 1.86% 1934 - 1.19% 0.28% 7.96% 1935 46.74% 0.17% 4.47% 1936 31.94% 0.17% 5.02% 1937 -35.34% 0.28% 1.38% 1938 29.28% 0.07% 4.21% % % 1939 -1.10% 0.05% 4.41% 1940 -10.67% 0.045 5.40% 1941 -12.72% 0.13% -2.02% 1942 19.17% 0.34% 2.29% 1943 25.06% 0.38% 2.49% 1944 19.03% 0.38% 2.58% % 1945 35.82% 0.38% 3.80% 1946 -8.43% 0.38% % 3.13% 1947 5.20% 0.60% 0.92% 1948 5.70% 1.05% 1.95% 1949 18.30% 1.12% 4.66% 1950 30.81% 1.20% 0.43% % 1951 23.68% 1.52% -0.30% 1952 18.15% 1.72% 2.27% 1953 -1.21% 1.89% % % 4.14% 1954 52.56% 0.94% 3.29% 1955 32.60% 1.73% -1.34% 1956 7.44% 2.63% -2.26% 1957 -10.46% 3.23% 6.80% 1958 43.72% 1.77% -2.10% 1959 12.06% 3.39% -2.65% % 1960 0.34% 2.88% 11.64% 1961 26.64% 2.35% 2.06% 1962 -8.81% 2.77% 5.69% % 1963 22.61% 3.16% 1.68% 1964 16.42% 3.55% 3.73% % % 1965 12.40% 3.95% 0.72% 1966 -9.97% 4.86% 2.91% % 1967 23.80% 4.31% -1.58% % % LAT. 2012 15.89% 0.09% 2.97% % 2013 32.15% 0.06% -9.10% 2014 13.52% 0.03% 10.75% 2015 1.38% 0.05% 1.28% 2016 11.77% 0.32% 0.69% 2017 21.61% % 0.93% 2.80% 2018 -4.23% 1.94% -0.02% 2019 31.21% 1.55% 9.61% 2020 18.02% 0.09% 11.33% 2021 28.47% 0.06% -4.42% 1968 10.81% 5.34% 3.27% 1969 -8.24% 6.67% -5.01% % % 1970 3.56% 6.39% 16.75% 1971 14.22% 4.33% 9.79% 1972 18.76% 4.07% 2.82% 1973 14.31% 7.03% 3.66% 1974 -25.90% 7.83% 1.99% 1975 37.00% 5.789 3.61% 1976 23.83% 4.97% 15.98% 1977 -6.98% 5.27% 1.29% 1978 6.51% 7.19% -0.78% % 1979 18.52% 10.07% 0.67% 1980 31.74% 11.43% -2.99% % 1981 -4.70% 14.03% 8.20% 1982 20.42% 10.61% 32.81% 1983 22.31% 8.61% 3.20% 1984 6.15% % 9.52% 13.73% 1985 31.24% 7.48% 25.71% % 1986 18.49% 5.9AX 24.28% 1987 5.81% 5.78% -4.96% 1988 15.5.1% 6.67% 8.22% 1989 31.48% 8.11% 17.69% 1990 -3.06% 7.49% 6.24% 1991 30.23% 5.38% 15.00% 1992 7.49% 3.43% 9.36% 1993 9.97% 3.00% 14.21% 1994 1.33% 4.25% -8.04% % 1995 37.20% 5.49% 23.48% 1996 22.68% 5.01% 1.43% % 1997 33.10% 5.05% % 9.94% 1998 28.34% 4.78% 14.92% 1999 20.89% 4.64% -8.25% 2000 -9.02% 5.82% 16.66% 2001 -11.85% 3.39% 5.57% 2002 -21.97% 1.60% 15.12% 2003 28.36% 1.01% 0.38% 2004 10.74% 1.37% 4.49% 2005 4.83% 3.15% 2.87% 2006 15.61% 4.73% 1.96% 2007 5.48% 4.35% 10.21% 2008 -36.55% 1.37% 20.10% 2009 25.94% 0.15% -11.12% 2010 14.82% % 0.14% 8.46% % 2011 2.10% % 0.05% 16.04%
Step by Step Solution
There are 3 Steps involved in it

Get step-by-step solutions from verified subject matter experts