

Question: Reference table: Exposure Total Number Prevalence category MDRSA No MDRSA of Children Ratio* IHO Parent 47 181 228 CR Parent 16 x .85=14 186 x
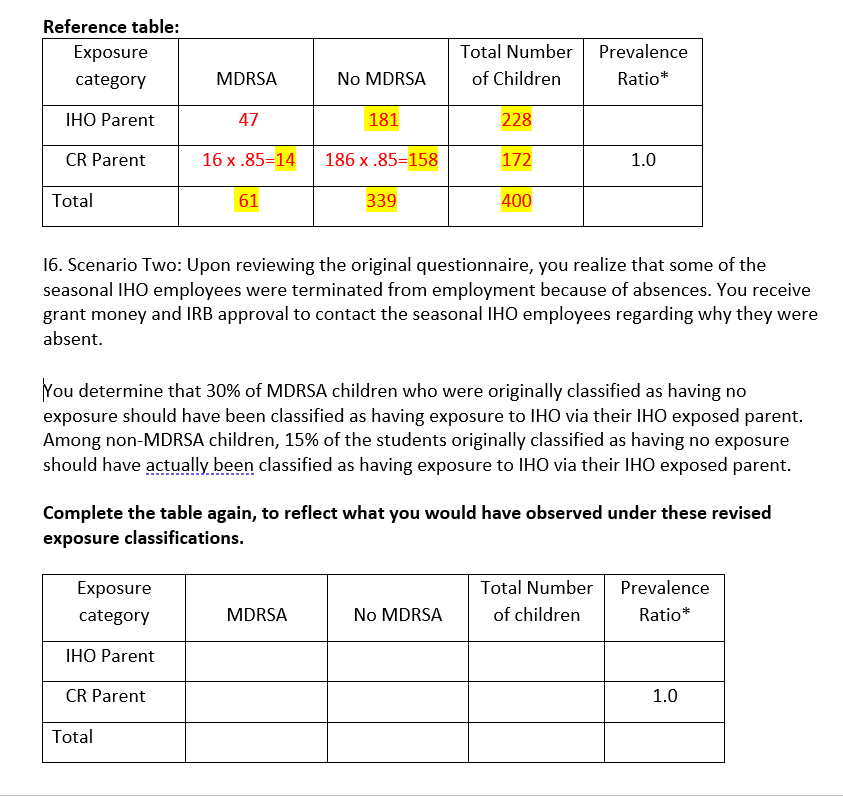

Reference table: Exposure Total Number Prevalence category MDRSA No MDRSA of Children Ratio* IHO Parent 47 181 228 CR Parent 16 x .85=14 186 x .85=158 172 1.0 Total 61 339 400 16. Scenario Two: Upon reviewing the original questionnaire, you realize that some of the seasonal IHO employees were terminated from employment because of absences. You receive grant money and IRB approval to contact the seasonal IHO employees regarding why they were absent. You determine that 30% of MDRSA children who were originally classified as having no exposure should have been classified as having exposure to IHO via their IHO exposed parent. Among non-MDRSA children, 15% of the students originally classified as having no exposure should have actually been classified as having exposure to IHO via their IHO exposed parent. Complete the table again, to reflect what you would have observed under these revised exposure classifications. Exposure Total Number Prevalence category MDRSA No MDRSA of children Ratio* IHO Parent CR Parent 1.0 Total
Step by Step Solution
There are 3 Steps involved in it

Get step-by-step solutions from verified subject matter experts