

Question: #REFERENCES #Ref: https://www.statmethods.net/advgraphs/ggplot2.html #Ref: https://www.datanovia.com/en/blog/ggplot-point-shapes-best-tips/ #Ref: http://environmentalcomputing.net/plotting-with-ggplot-colours-and-symbols/ #Ref: Andy Fields: Discovering Statistics Using R #Ref: R Kabacoff: R in Action #DIRECTIONS #After each numbered item,
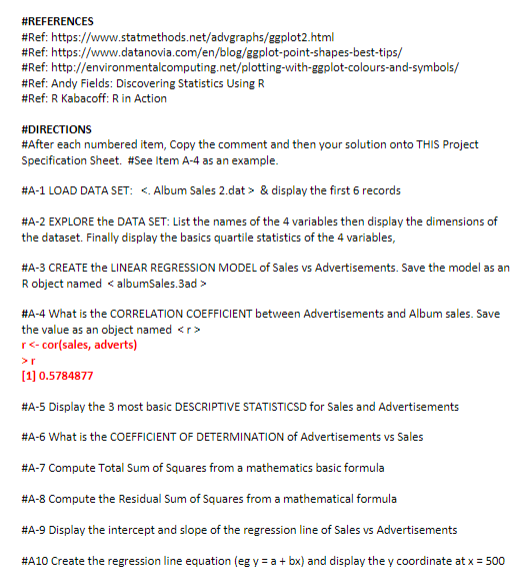


#REFERENCES #Ref: https://www.statmethods.net/advgraphs/ggplot2.html #Ref: https://www.datanovia.com/en/blog/ggplot-point-shapes-best-tips/ #Ref: http://environmentalcomputing.net/plotting-with-ggplot-colours-and-symbols/ #Ref: Andy Fields: Discovering Statistics Using R #Ref: R Kabacoff: R in Action #DIRECTIONS #After each numbered item, Copy the comment and then your solution onto THIS Project Specification Sheet. #See Item A-4 as an example. #A-1 LOAD DATA SET: <. album sales> & display the first 6 records #A-2 EXPLORE the DATA SET: List the names of the 4 variables then display the dimensions of the dataset. Finally display the basics quartile statistics of the 4 variables, #A-3 CREATE the LINEAR REGRESSION MODEL of Sales vs Advertisements. Save the model as an R object named #A-4 What is the CORRELATION COEFFICIENT between Advertisements and Album sales. Save the value as an object named
Step by Step Solution
There are 3 Steps involved in it

Get step-by-step solutions from verified subject matter experts