

Question: References: Tables: https://www.webassign.net/aswsbe13/appendix-b.pdf Distribution Technology: https://www.webassign.net/tparise/beta/stats/distributionIndex.html You may need to use the appropriate appendix table or technology to answer this question. Last year, 52% of
References:
Tables: https://www.webassign.net/aswsbe13/appendix-b.pdf
Distribution Technology: https://www.webassign.net/tparise/beta/stats/distributionIndex.html
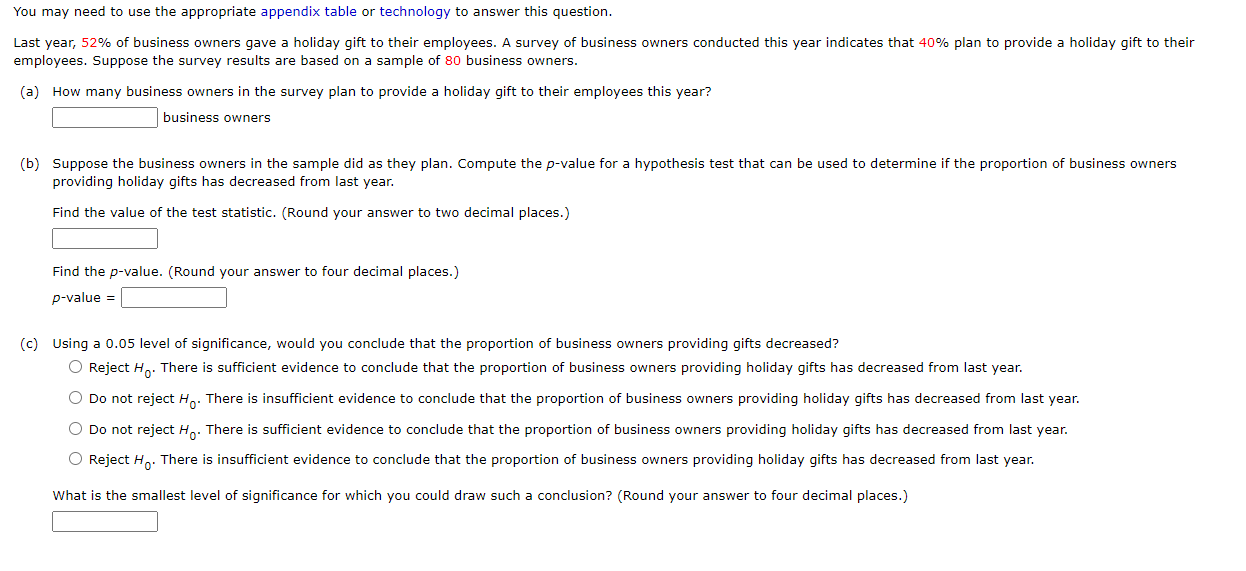
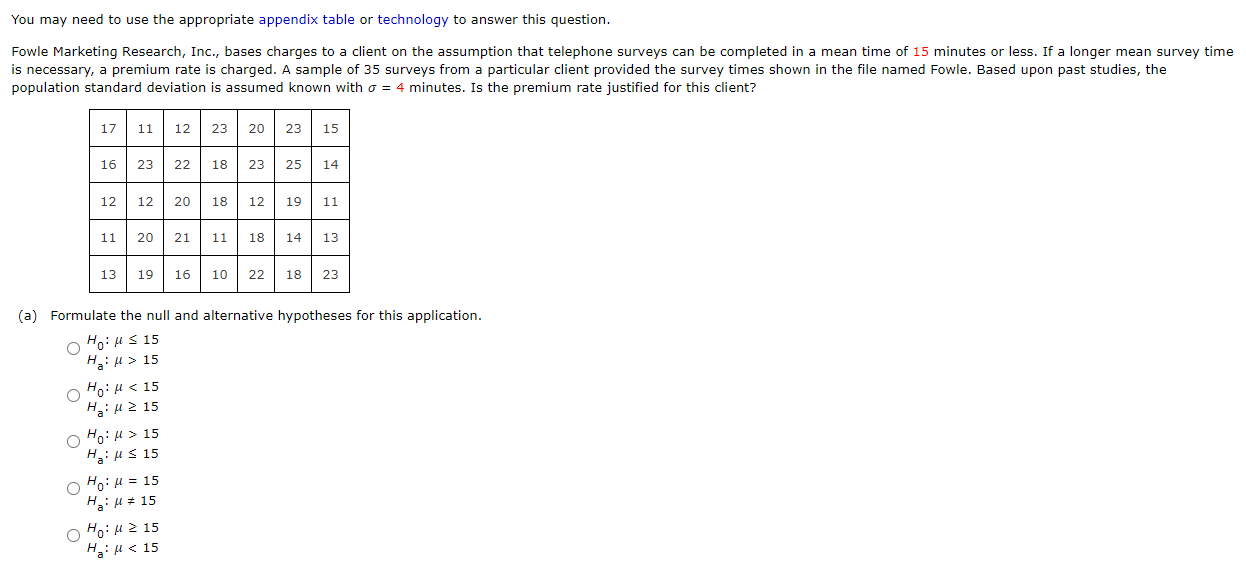
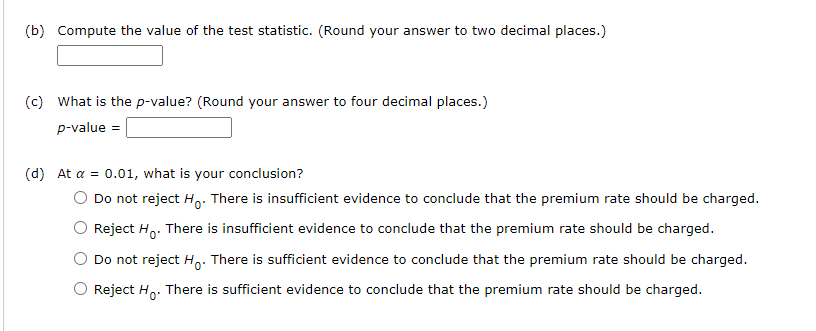
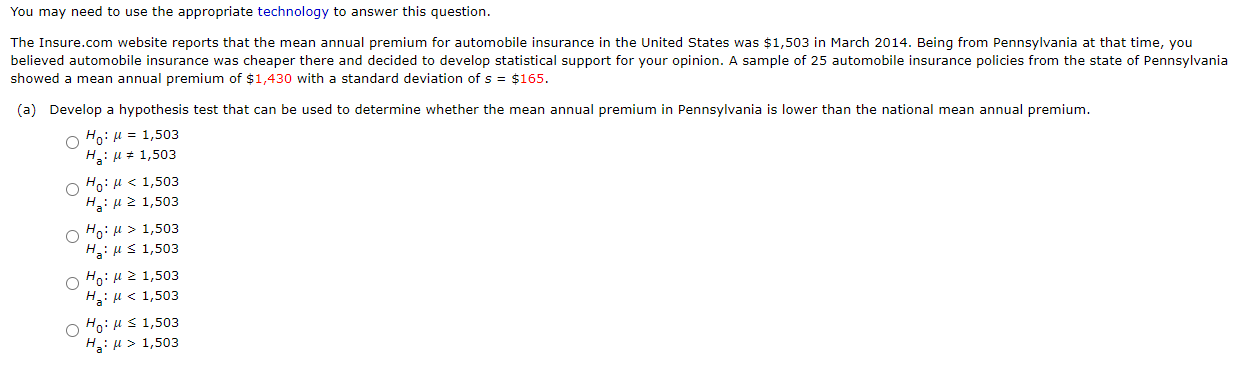
You may need to use the appropriate appendix table or technology to answer this question. Last year, 52% of business owners gave a holiday gift to their employees. A survey of business owners conducted this year indicates that 40% plan to provide a holiday gift to their employees. Suppose the survey results are based on a sample of 80 business owners. (a) How many business owners in the survey plan to provide a holiday gift to their employees this year? business owners (b) Suppose the business owners in the sample did as they plan. Compute the p-value for a hypothesis test that can be used to determine if the proportion of business owners providing holiday gifts has decreased from last year. Find the value of the test statistic. (Round your answer to two decimal places.) Find the p-value. (Round your answer to four decimal places.) p-value = (c) Using a 0.05 level of significance, would you conclude that the proportion of business owners providing gifts decreased? O Reject H . There is sufficient evidence to conclude that the proportion of business owners providing holiday gifts has decreased from last year. O Do not reject Ho. There is insufficient evidence to conclude that the proportion of business owners providing holiday gifts has decreased from last year. O Do not reject Ho. There is sufficient evidence to conclude that the proportion of business owners providing holiday gifts has decreased from last year. O Reject Ho. There is insufficient evidence to conclude that the proportion of business owners providing holiday gifts has decreased from last year. What is the smallest level of significance for which you could draw such a conclusion? (Round your answer to four decimal places.)You may need to use the appropriate appendix table or technology to answer this question. Fowle Marketing Research, Inc., bases charges to a client on the assumption that telephone surveys can be completed in a mean time of 15 minutes or less. If a longer mean survey time is necessary, a premium rate is charged. A sample of 35 surveys from a particular client provided the survey times shown in the file named Fowle. Based upon past studies, the population standard deviation is assumed known with o = 4 minutes. Is the premium rate justified for this client? 17 11 12 23 20 23 15 16 23 22 18 23 25 14 12 12 20 18 12 19 11 11 20 21 11 18 14 13 13 19 16 10 22 18 23 (a) Formulate the null and alternative hypotheses for this application. Hot us 15 H_: M > 15 O Ho: H 15 O He: us 15 O Ho: M = 15 He: M = 15 Ho: M 2 15 He: M 1,503 1,503 1,503 1,503 1,503 1,503 1,503 1,503 (b) What is a point estimate in dollars of the dierence between the mean annual premium in Pennsylvania and the national mean? [Use the mean annual premium in Pennsylvania minus the nationai mean.) $|:| (c) At a = 0.05, test for a signicant diFference. Find the value of the test statistic. (Round your answer to three decimal places.) |:| Find the pvalue. (Round your answer to four decimal places.) State your conclusion. 0 Do not reject Ho. We cannot conclude that the population mean automobile premium in Pennsylvania is lower than the national mean. 0 Reject H0. We cannot conclude that the population mean automobile premium in Pennsylvania is lower than the national mean. 0 Reject H0. We can conclude that the population mean automobile premium in Pennsylvania is lower than the national mean. 0 Do not reject \"0' We can conclude that the population mean automobile premium in Pennsylvania is lower than the national mean
Step by Step Solution
There are 3 Steps involved in it

Get step-by-step solutions from verified subject matter experts