

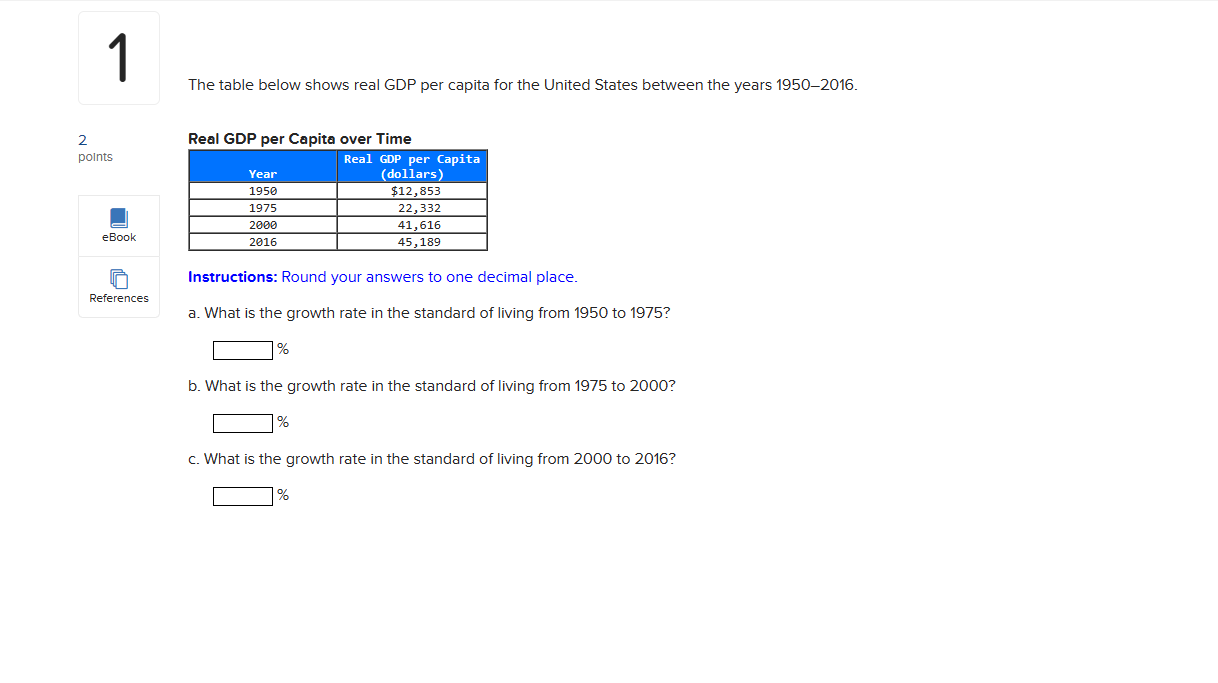
Question: References The table below shows real GDP per capita for the United States between the years 1950-2016. Real GDP per Capita over Time Real GDP

![[ ce6 ] 45,189 Instructions: Round your answers to one decimal place.](https://s3.amazonaws.com/si.experts.images/answers/2024/06/6673f33396f01_9316673f33381b17.jpg)

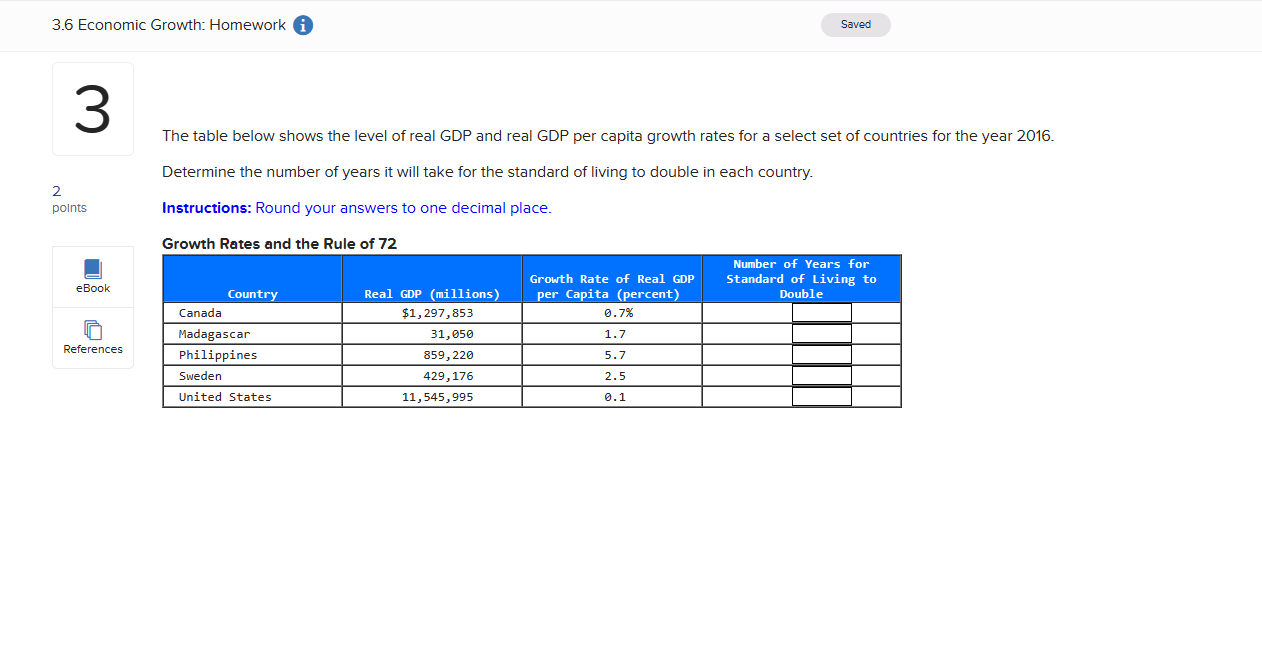

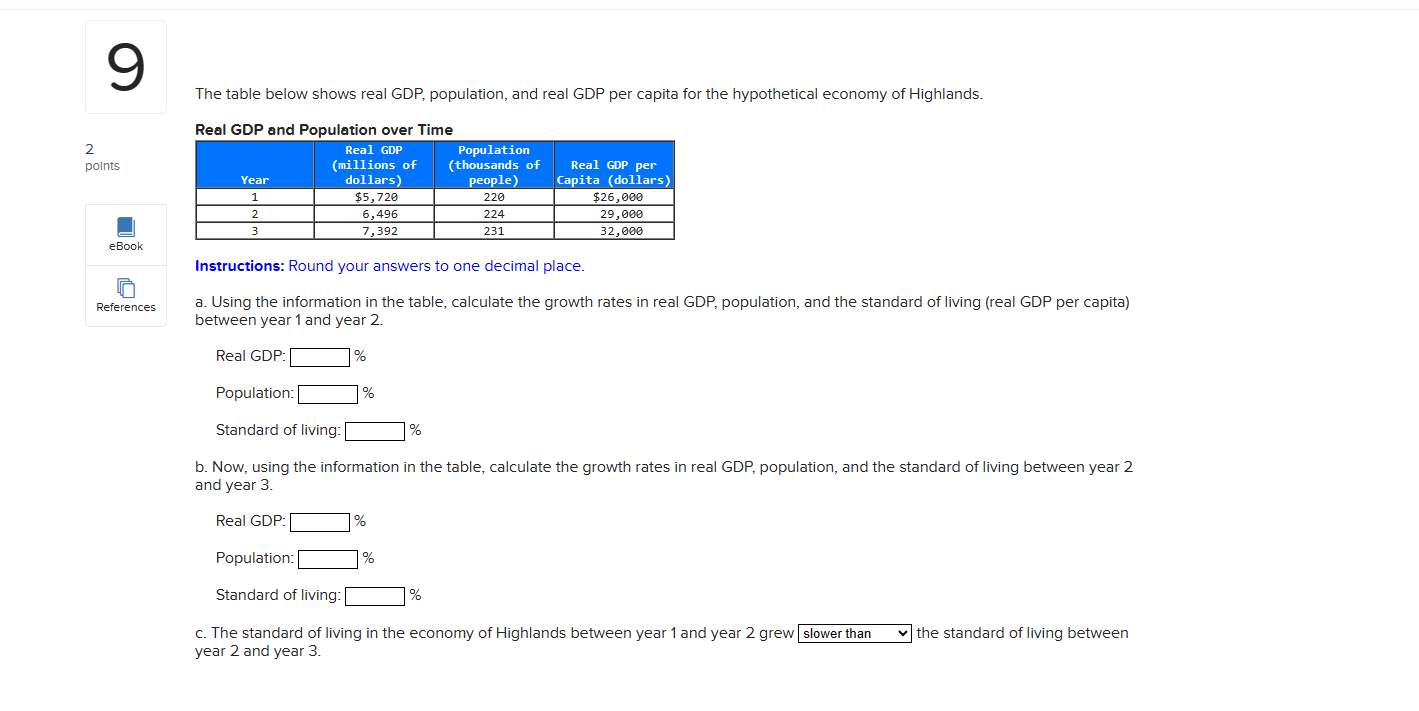
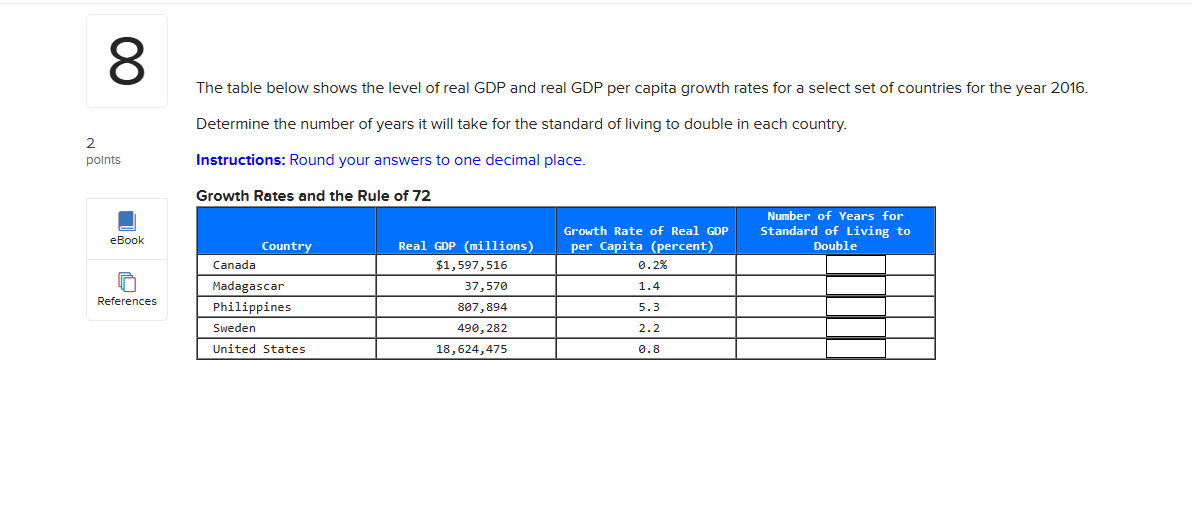
References The table below shows real GDP per capita for the United States between the years 1950-2016. Real GDP per Capita over Time Real GDP per Capita A CE (dollars) 1950 512,853 1975 22,332 41,616 [ ce6 ] 45,189 Instructions: Round your answers to one decimal place. a. What is the growth rate in the standard of living from 1950 to 19757 % b. What is the growth rate in the standard of living from 1975 to 20007 % c. What is the growth rate in the standard of living from 2000 to 20167 % 3.6 Economic Growth: Homework i Saved 3 The table below shows the level of real GDP and real GDP per capita growth rates for a select set of countries for the year 2016. Determine the number of years it will take for the standard of living to double in each country. 2 points Instructions: Round your answers to one decimal place. Growth Rates and the Rule of 72 Number of Years for Growth Rate of Real GDP Standard of Living to eBook Country Real GDP (millions) per Capita (percent Double Canada $1, 297, 853 0.7% Madagascar 31, 050 1.7 References Philippines 859, 220 5.7 Sweden 429, 176 2.5 United States 11, 545,995 0.1The table below shows the level of real GDP and real GDP per capita growth rates for a select set of countries for the year 2016. Determine the number of years it will take for the standard of living to double in each country. points Instructions: Round your answers to one decimal place. Growth Rates and the Rule of 72 ! Number of Years for Growth Rate of Real GDP Standard of Living to #Book Country Real GDP (millions) per Capita (percent) IE Madagascar C The table below shows real GDP, population, and real GDP per capita for the hypothetical economy of Highlands. Real GDP and Population over Time 2 Real GDP Population points (millions of (thousands of Real GDP per Year dollars people) Capita (dollars) 1 $5,720 220 $26,000 6,496 224 29,000 W N 7,392 231 32,000 eBook Instructions: Round your answers to one decimal place. References a. Using the information in the table, calculate the growth rates in real GDP, population, and the standard of living (real GDP per capita) between year 1 and year 2. Real GDP: % Population: % Standard of living: % b. Now, using the information in the table, calculate the growth rates in real GDP, population, and the standard of living between year 2 and year 3. Real GDP % Population: % Standard of living:[ % c. The standard of living in the economy of Highlands between year 1 and year 2 grew | slower than | the standard of living between year 2 and year 3
Step by Step Solution
There are 3 Steps involved in it

Get step-by-step solutions from verified subject matter experts