

Question: Referring to the chart below, what is the approximate probability that a randomly chosen student (who is part of the population reflected in the chart)
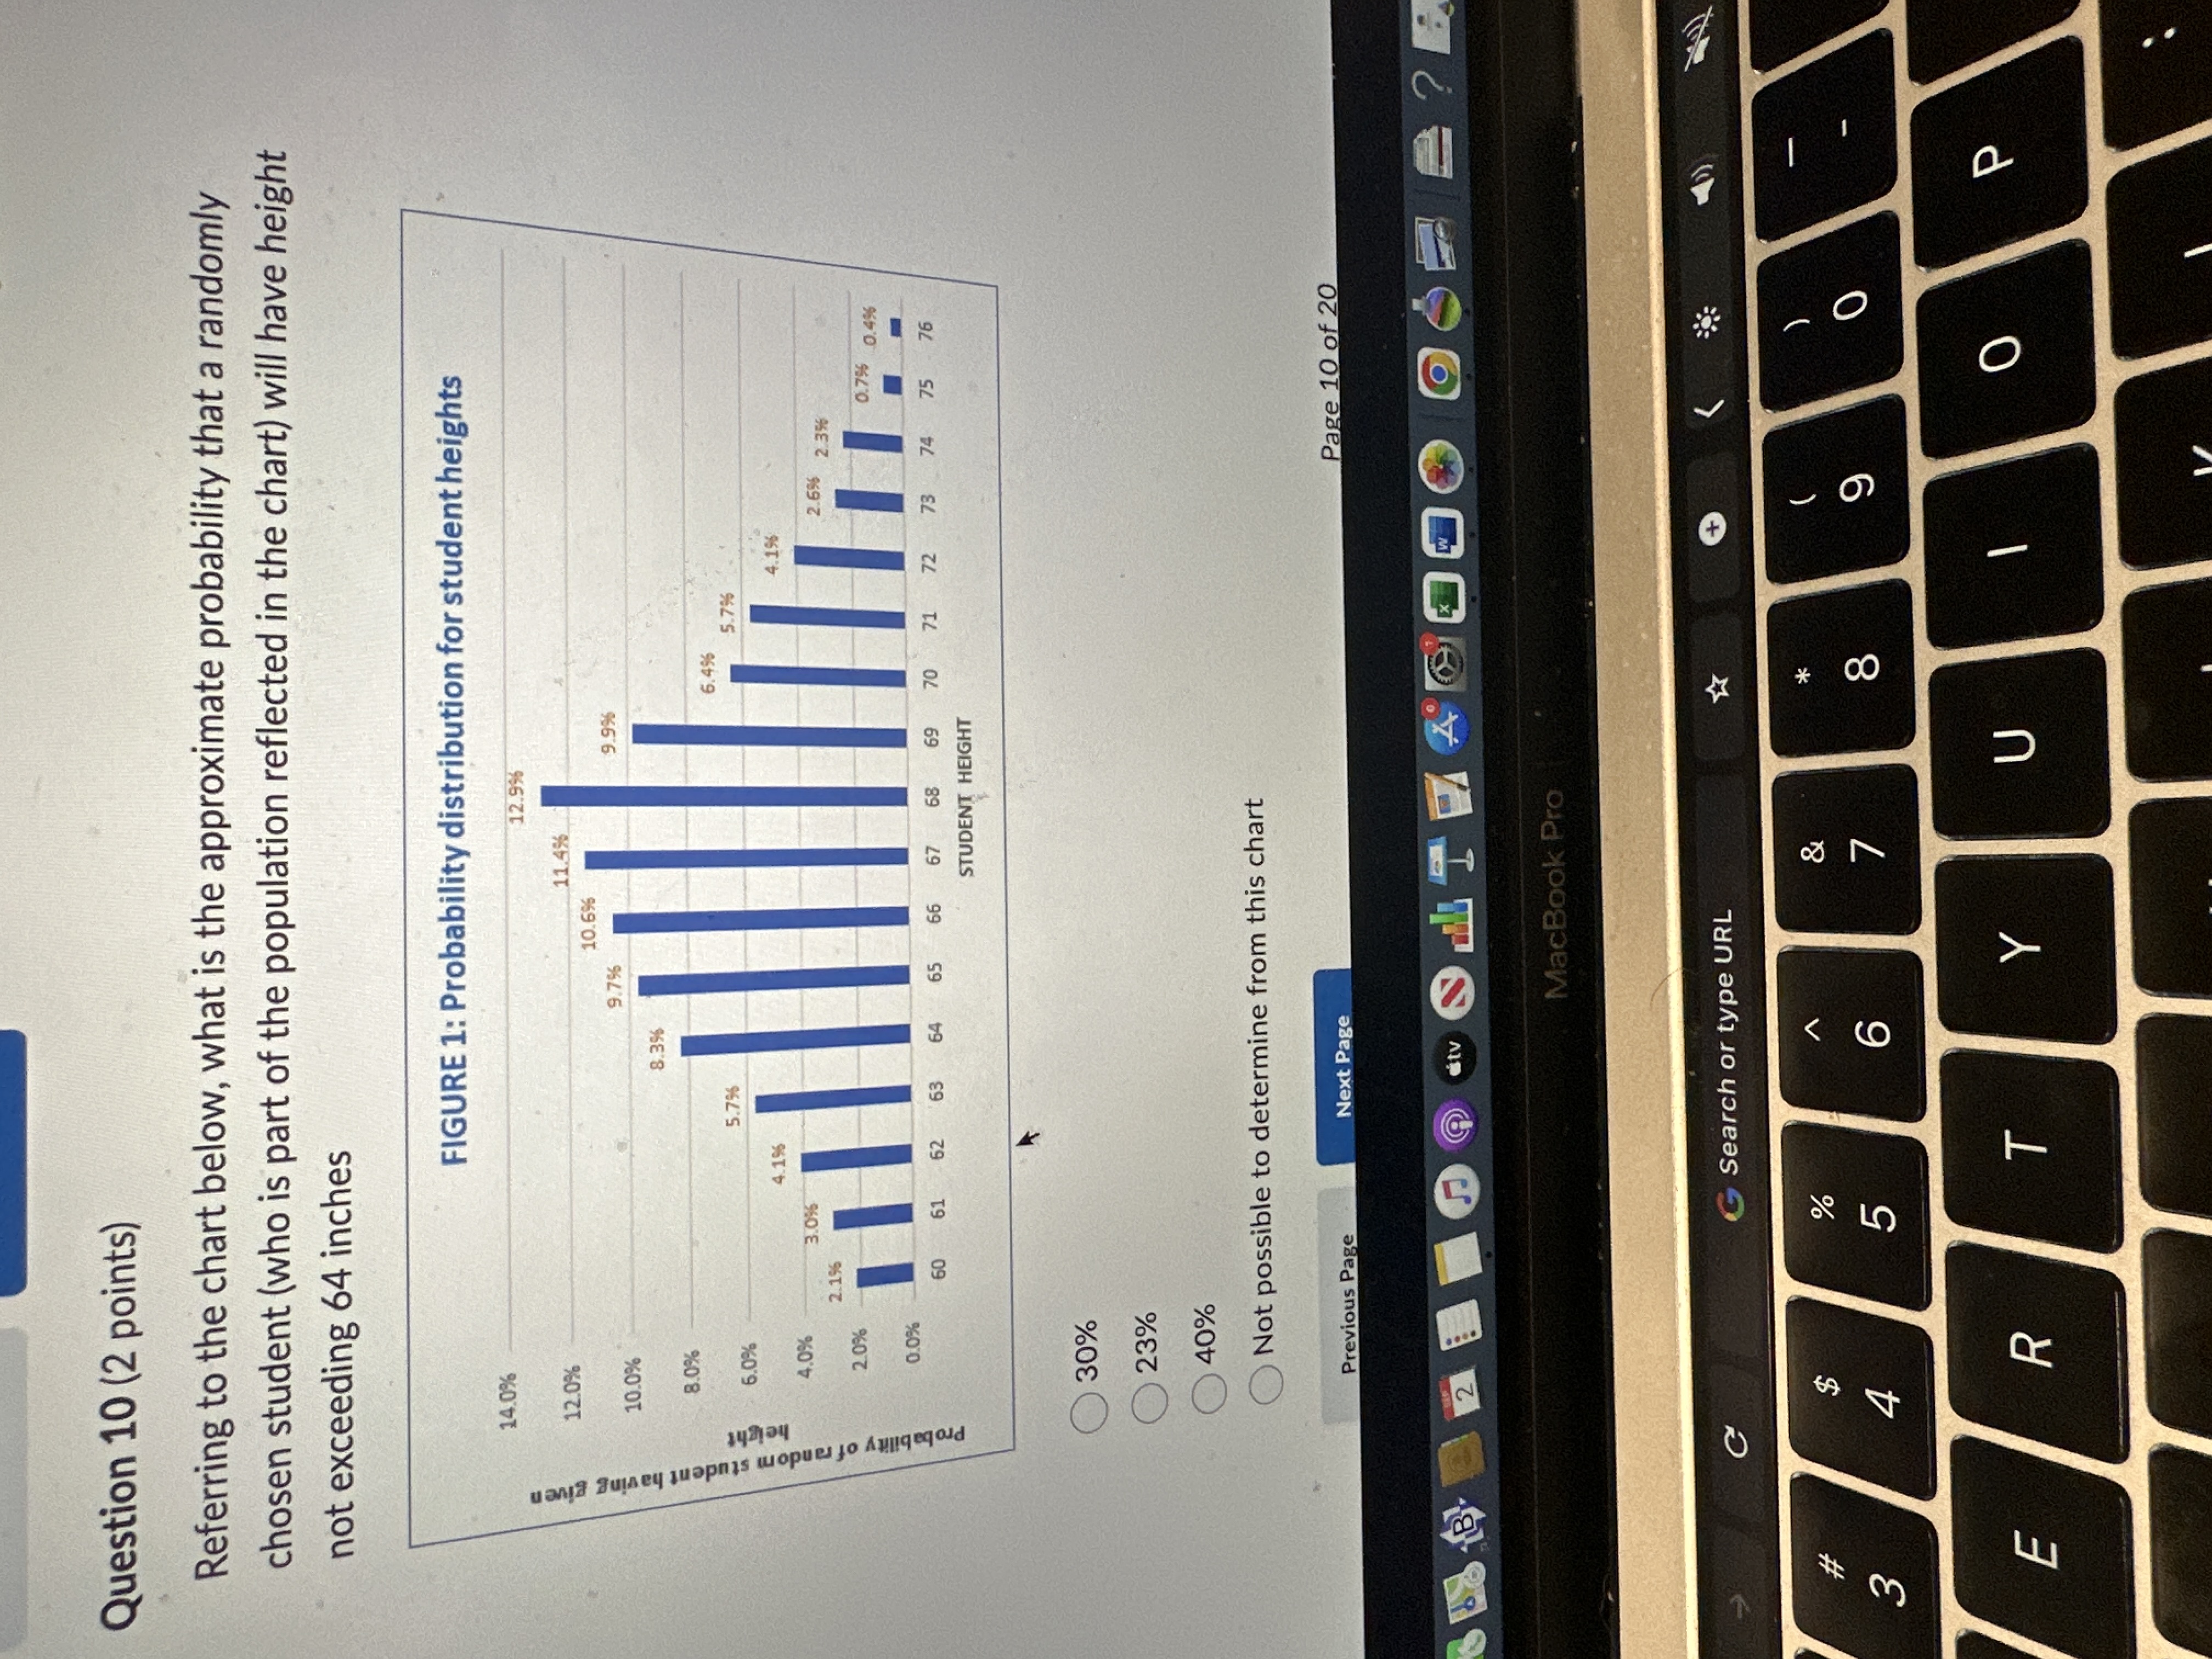
Referring to the chart below, what is the approximate probability that a randomly chosen student (who is part of the population reflected in the chart) will have height not exceeding 64 inches
Step by Step Solution
There are 3 Steps involved in it
1 Expert Approved Answer
Step: 1 Unlock

Question Has Been Solved by an Expert!
Get step-by-step solutions from verified subject matter experts
Step: 2 Unlock
Step: 3 Unlock