

Question: Regarding the graph below: 5) What can be said in 2016 about the funds that have a vintage year from 2000 to 2004? (20 points)
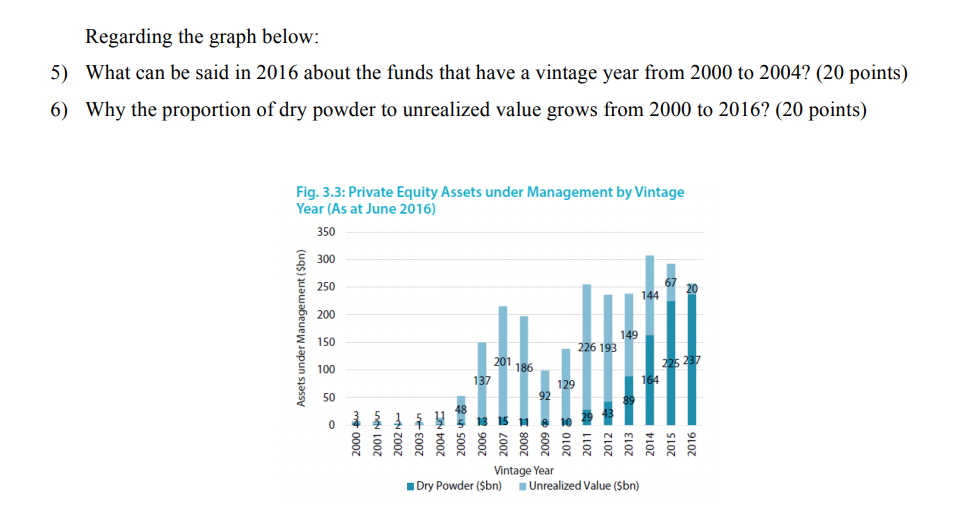
Regarding the graph below: 5) What can be said in 2016 about the funds that have a vintage year from 2000 to 2004? (20 points) 6) Why the proportion of dry powder to unrealized value grows from 2000 to 2016? (20 points) Fig. 3.3: Private Equity Assets under Management by Vintage Year (As at June 2016) 350 300 250 144 200 Assets under Management ($bn) 150 149 226 193 201 186 100 50 0 2000 su 2001 2010 2011 2012 CLOZ 2014 2015 Vintage Year Dry Powder ($bn) Unrealized Value ($bn) Regarding the graph below: 5) What can be said in 2016 about the funds that have a vintage year from 2000 to 2004? (20 points) 6) Why the proportion of dry powder to unrealized value grows from 2000 to 2016? (20 points) Fig. 3.3: Private Equity Assets under Management by Vintage Year (As at June 2016) 350 300 250 144 200 Assets under Management ($bn) 150 149 226 193 201 186 100 50 0 2000 su 2001 2010 2011 2012 CLOZ 2014 2015 Vintage Year Dry Powder ($bn) Unrealized Value ($bn)
Step by Step Solution
There are 3 Steps involved in it

Get step-by-step solutions from verified subject matter experts