

Question: Regression Analysis: Based on the data below, analyze the statistical relationship of a firm's EPS as a function of sales, tax, assets, and common
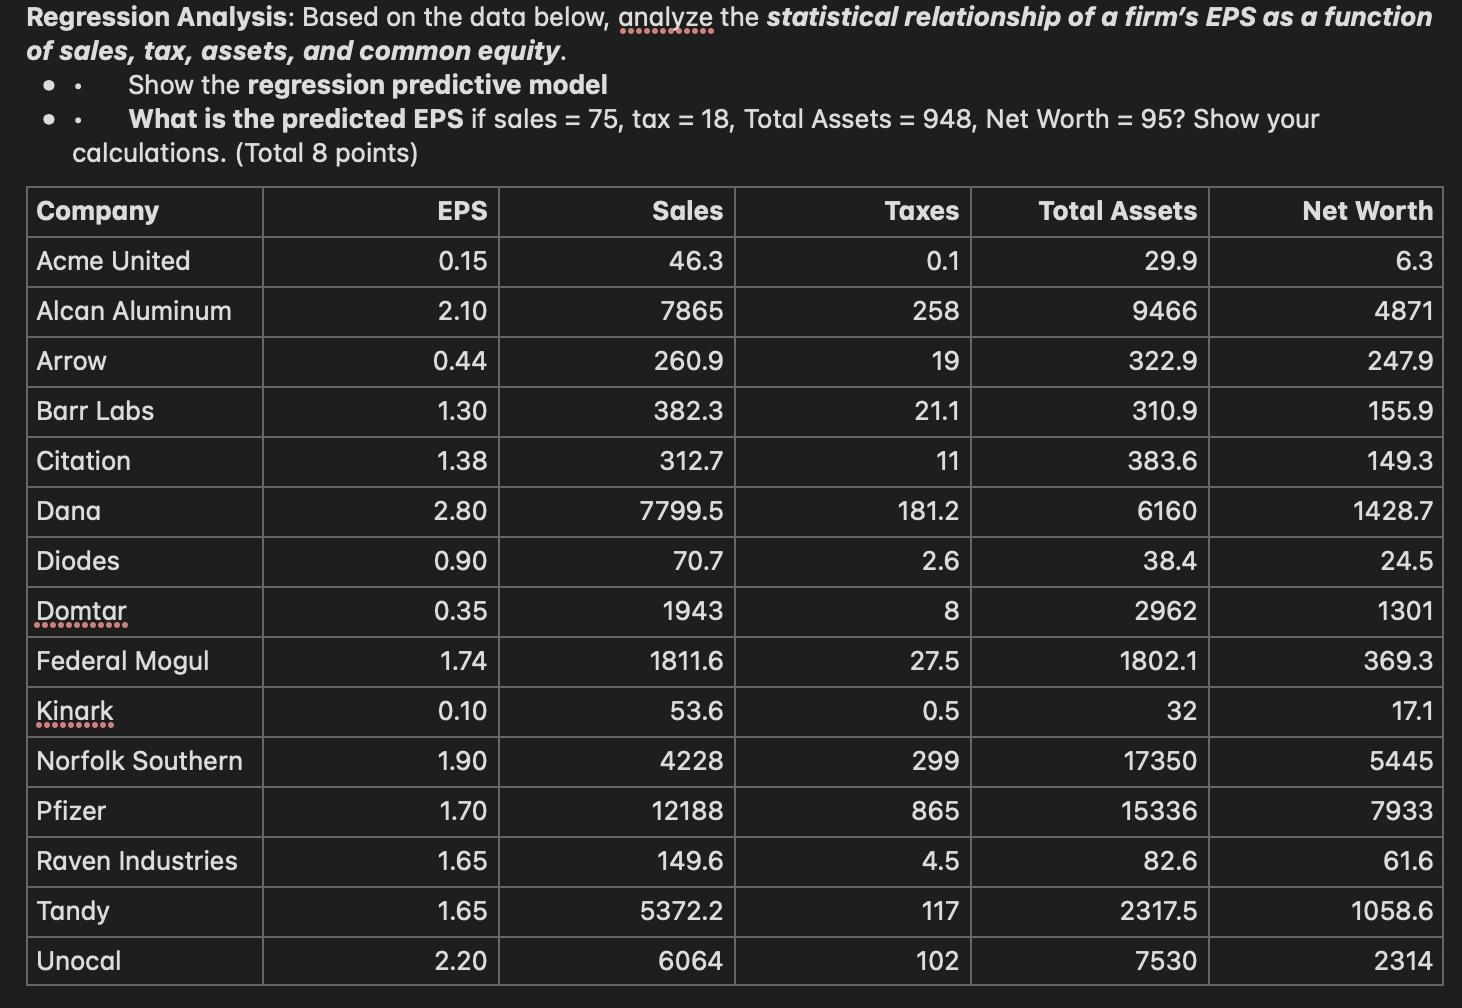
Regression Analysis: Based on the data below, analyze the statistical relationship of a firm's EPS as a function of sales, tax, assets, and common equity. Show the regression predictive model What is the predicted EPS if sales = 75, tax = 18, Total Assets = 948, Net Worth = 95? Show your calculations. (Total 8 points) Company EPS Sales Taxes Total Assets Net Worth Acme United 0.15 46.3 0.1 29.9 6.3 Alcan Aluminum 2.10 7865 258 9466 4871 Arrow 0.44 260.9 19 322.9 247.9 Barr Labs 1.30 382.3 21.1 310.9 155.9 Citation 1.38 312.7 11 383.6 149.3 Dana 2.80 7799.5 181.2 6160 1428.7 Diodes 0.90 70.7 2.6 38.4 24.5 Domtar 0.35 1943 8 2962 1301 Federal Mogul 1.74 1811.6 27.5 1802.1 369.3 Kinark 0.10 53.6 0.5 32 17.1 Norfolk Southern 1.90 4228 299 17350 5445 Pfizer 1.70 12188 865 15336 7933 Raven Industries 1.65 149.6 4.5 82.6 61.6 Tandy 1.65 5372.2 117 2317.5 1058.6 Unocal 2.20 6064 102 7530 2314
Step by Step Solution
3.49 Rating (149 Votes )
There are 3 Steps involved in it
Solution Solution a Fitting the Regression Model on the data Regression Statistics Multiple R 080619... View full answer

Get step-by-step solutions from verified subject matter experts
Document Format (2 attachments)
6362e4b83d7da_237141.pdf
180 KBs PDF File
6362e4b83d7da_237141.docx
120 KBs Word File