

Question: Excel has significant capabilities including the statistical analysis of data. The purpose of this assignment is to determine the formula for a line from
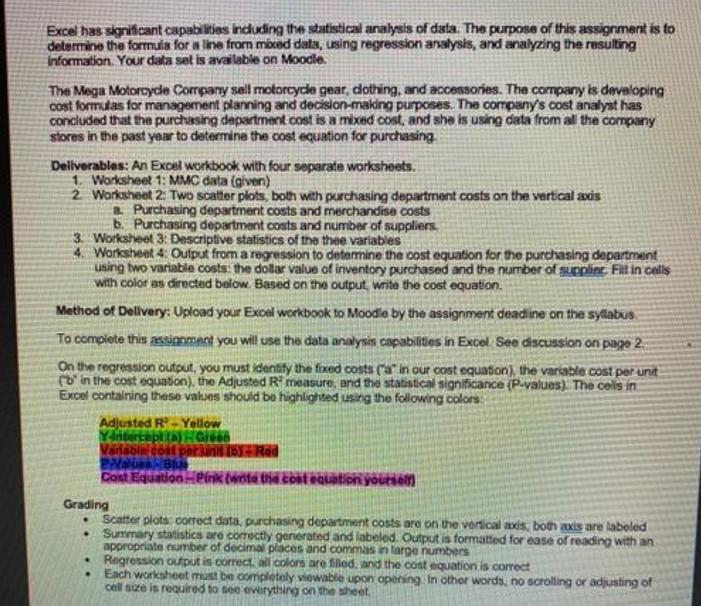
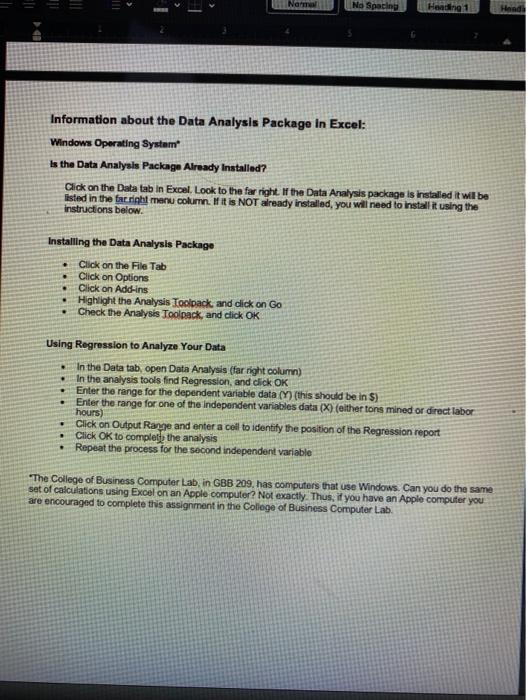
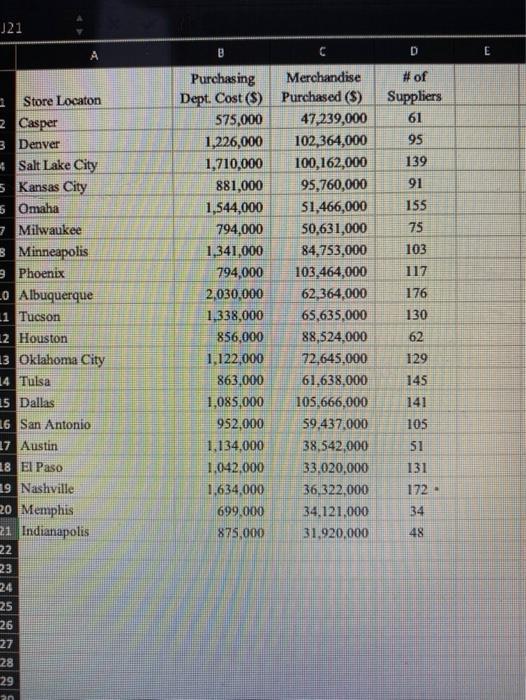
Excel has significant capabilities including the statistical analysis of data. The purpose of this assignment is to determine the formula for a line from mixad data, using regression analysis, and analyzing the resulting information. Your data set is available on Moodle. The Mega Motorcyde Cormpany sell motorcycle gear, dothing, and accessories. The company is developing cost formulas for management planning and decision-making purposes. The company's cost analyst has concluded that the purchasing department cost is a mixed cost, and she is using data from all the company stores in the past year to determine the cost equation for purchasing Deliverables: An Excel workbook with four separate worksheets. 1. Worksheet 1: MMC data (given) 2 Worksheet 2: Two scatter plots, both with purchasing department costs on the vertical axis a Purchasing department costs and merchandise costs b. Purchasing department costs and number of suppliers 3. Worksheet 3: Descriptive statistics of the thee variables Worksheet 4: Output from a regression to determine the cost equation for the purchasing department using two variable costs: the dollar value of inventory purchased and the number of supplinr. Fit in cells with color as directed below. Based on the output, write the cost equation. Method of Delivery: Upload your Excel workbook to Moodle by the assignment deadine on the syllabus To complete this assignment you will use the data analysis capabilities in Excel See discussion on page 2. On the regression output, you must identify the fixed costs (a" in our cost equation), the variable cost per unit (b in the cost equation), the Adjusted R measure, and the statistical significance (P-values) The cells in Excel containing these values should be highlighted using the following colors Adjusted R-Yellow Vaifablni cont phrkin 16)Rd Cost Equationeink (wite the costeqiation yoursel Grading Scatter plots correct data, purchasing department costs are on the vertical ais, both axis are laboled Sumenary statistics are correctly generated and labeled. Output is formatted for ease of reading with an appropriate number of decimal places and commas in large numbers Regression output is correct, all colors are filled, and the cost equation is correct Each worksheet must be completely viewable upon opening In other words, no scrolling or adjusting of cell size is reQuired to see everything on the sheet. Nerma No Spacing Heading 1 Information about the Data Analysis Package in Excel: Windows Operating Systam is the Data Analysis Package Already Installed? Click on the Data tab in Excel. Look to the far right If the Data Analysis package is installed it will be isted in the farright menu column. If it is NOT already installed, you will need to install it using the instructions below. Installing the Data Analysis Package Click on the File Tab Click on Options Click on Add-ins Highlight the Analysis Toolpack, and dlick on Go Check the Analysis Toolpack, and click OK Using Regression to Analyze Your Data In the Data tab, open Data Analysis (far right column) In the analysis tools find Regression, and cick OK Enter the range for the dependent variable data (Y) (this should be in $) .Enter the range for one of the independent variables data (X) (elther tons mined or direct labor hours) Click on Output Range and enter a cell to identify the position of the Regression report Click OK to complett the analysis Repeat the process for the second independent variable The College of Business Computer Lab, in GBB 209, has computers that use Windows. Can you do the same set of calculations using Excel on an Apple computer? Not exactly. Thus, if you have an Apple computer you are encouraged to complete this assignment in the College of Business Computer Lab. 121 A # of Suppliers Purchas ing Dept. Cost ($) Purchased ($) 575,000 1,226,000 1,710,000 Merchandise a Store Locaton 47,239,000 61 2 Casper 3 Denver 4Salt Lake City 5 Kansas City 5 Omaha Milwaukee 102,364,000 95 100,162,000 139 95,760,000 51,466,000 881,000 91 155 1,544,000 794,000 1,341,000 794,000 50,631,000 75 8 Minneapolis 9 Phoenix 84,753,000 103 103,464,000 117 LO Albuquerque 1 Tucson 2,030,000 62,364,000 176 1,338,000 65,635,000 130 2 Houston 13 Oklahoma City 856,000 88,524,000 62 1,122,000 72,645,000 129 14 Tulsa 5 Dallas 863,000 61,638,000 145 1,085,000 105,666,000 59,437,000 141 16 San Antonio 17 Austin 18 El Paso 952,000 105 1.134,000 38,542,000 51 1,042,000 33,020,000 131 19 Nashville 20 Memphis 21 Indianapolis 1,634,000 699,000 36,322,000 172 - 34,121,000 34 875,000 31.920,000 48 22 23 24 25 26 27 28 29
Step by Step Solution
3.34 Rating (163 Votes )
There are 3 Steps involved in it
MCC data Store Location Purchasing DeptCost Merchandise Purchased of Suppliers Casper 575000 4723900... View full answer

Get step-by-step solutions from verified subject matter experts