

Question: Regression Analysis!! Regression Analysis!! Regression Analysis!! Regression Analysis!! f554 APPENDIX B TABLE B.1 National Football League 1976 Team Performance PAPER MATE X4 X6 X1 X8
Regression Analysis!! Regression Analysis!! Regression Analysis!! Regression Analysis!!
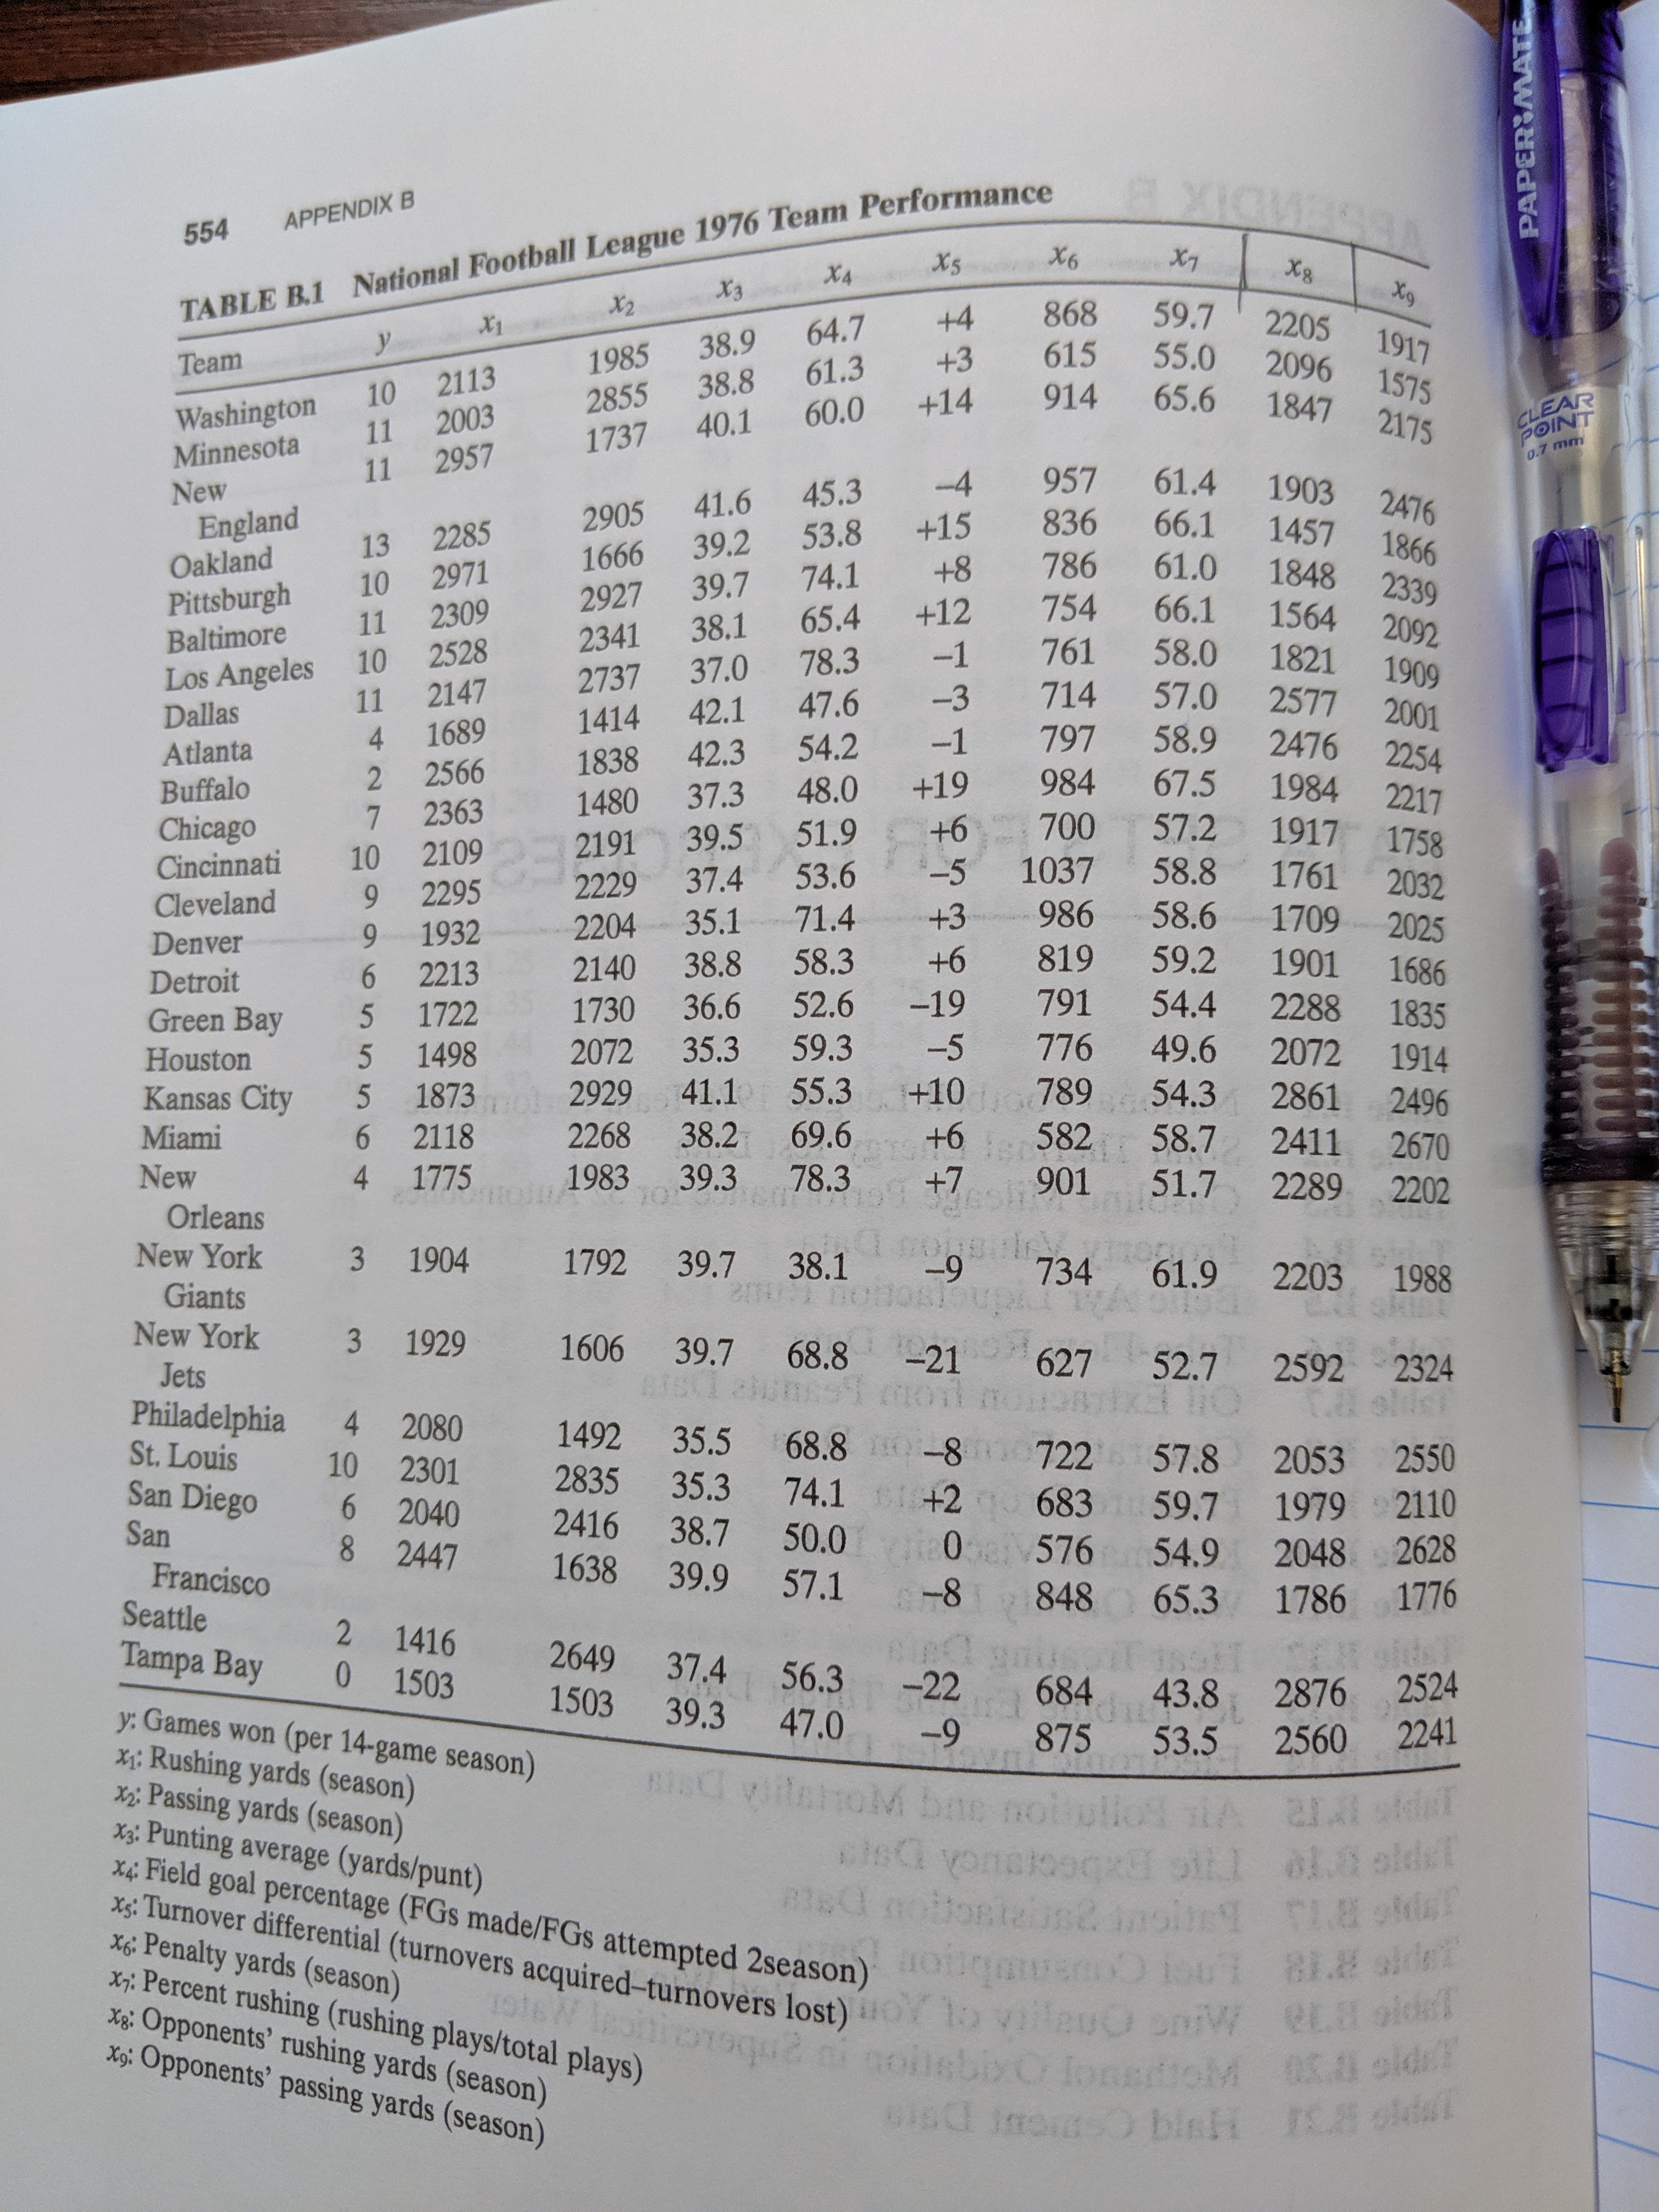
\f554 APPENDIX B TABLE B.1 National Football League 1976 Team Performance PAPER MATE X4 X6 X1 X8 X2 38.9 64.7 +4 59.7 X9 2205 10 2113 1985 1917 38.8 61.3 +3 2096 1575 Washington 11 2003 2855 914 2175 Minnesota 1737 60.0 1847 0.7 mm New 11 45.3 957 61.4 2905 41.6 1903 England 2476 Oakland 13 2971 1666 39.2 53.8 +15 836 66.1 1457 1866 Pittsburgh 10 2309 2927 39.7 74.1 +8 786 61.0 1848 11 754 66.1 2339 Baltimore 10 2528 2341 38.1 65.4 +12 1564 2092 Los Angeles 2737 37.0 78.3 -1 761 58.0 1821 Dallas 11 2147 714 57.0 2577 1909 Atlanta 4 1689 1414 47.6 1838 42.3 -1 797 58.9 2476 2001 2566 2254 Buffalo 2363 1480 37.3 48.0 +19 67.5 1984 2217 Chicago 10 2109 2191 39.5 51.9 +6 700 57.2 1917 Cincinnati 9 2295 2229 37.4 53.6 1037 58.8 1758 1761 Cleveland 9 1932 2204 71.4 +3 58.6 2032 Denver 1709 59.2 2025 Detroit 6 2213 2140 38.8 58.3 +6 819 1901 1686 Green Bay 5 1722 1730 36.6 52.6 791 54.4 2288 1835 Houston 1498 2072 35.3 59.3 776 49.6 2072 1914 Kansas City 5 1873 2929 41.1 55.3 +10 789 54.3 2861 2496 Miami 2118 2268 38.2 69.6 +6 582 58.7 2411 2670 New 4 1983 39.3 78.3 +7 901 51.7 2289 Orleans 2202 New York 3 1904 1792 39.7 Giants 38.1 2203 1988 New York 3 1929 Jets 1606 39.7 68.8 -21 627 52.7 2592 2324 Philadelphia 4 St. Louis 2080 1492 10 2301 35.5 2835 68.8 -8 722 57.8 2053 2550 San Diego 6 2040 2416 38.7 74.1 +20 683 59.7 1979 2110 San 8 2447 1638 50.0 Francisco 39.9 57.1 576 54.9 2048 2628 Seattle 848 65.3 1786 1776 Tampa Bay 0 1416 1503 2649 1503 37.4 56.3 -22 684 43.8 2876 2524 y: Games won (per 14-game season) 39.3 47.0 -9 875 2241 1: Rushing yards (season 53.5 2560 *2: Passing yards (season) X3: Punting average (yards/punt) x4: Field goal percentage (FGs made/FGs attempted 2season)gamer Ofout Bi.H alder x6: Penalty yards (season) X's: Turnover differential (turnovers acquired-turnovers lost) ON a villaud eniw eta aides x7: Percent rushing (rushing plays/total plays) *8: Opponents' rushing yards (season) X9: Opponents' passing yards (season)
Step by Step Solution
There are 3 Steps involved in it

Get step-by-step solutions from verified subject matter experts