

Question: Regression Analysis The regressiomations Y MARGIN = -154+ (a) ADVIL +0.80BAYER +3.0TYLENOL Predictor Coef SE Coef T P Constant -153.67 14.96 -10.27 0.000 ADVIL
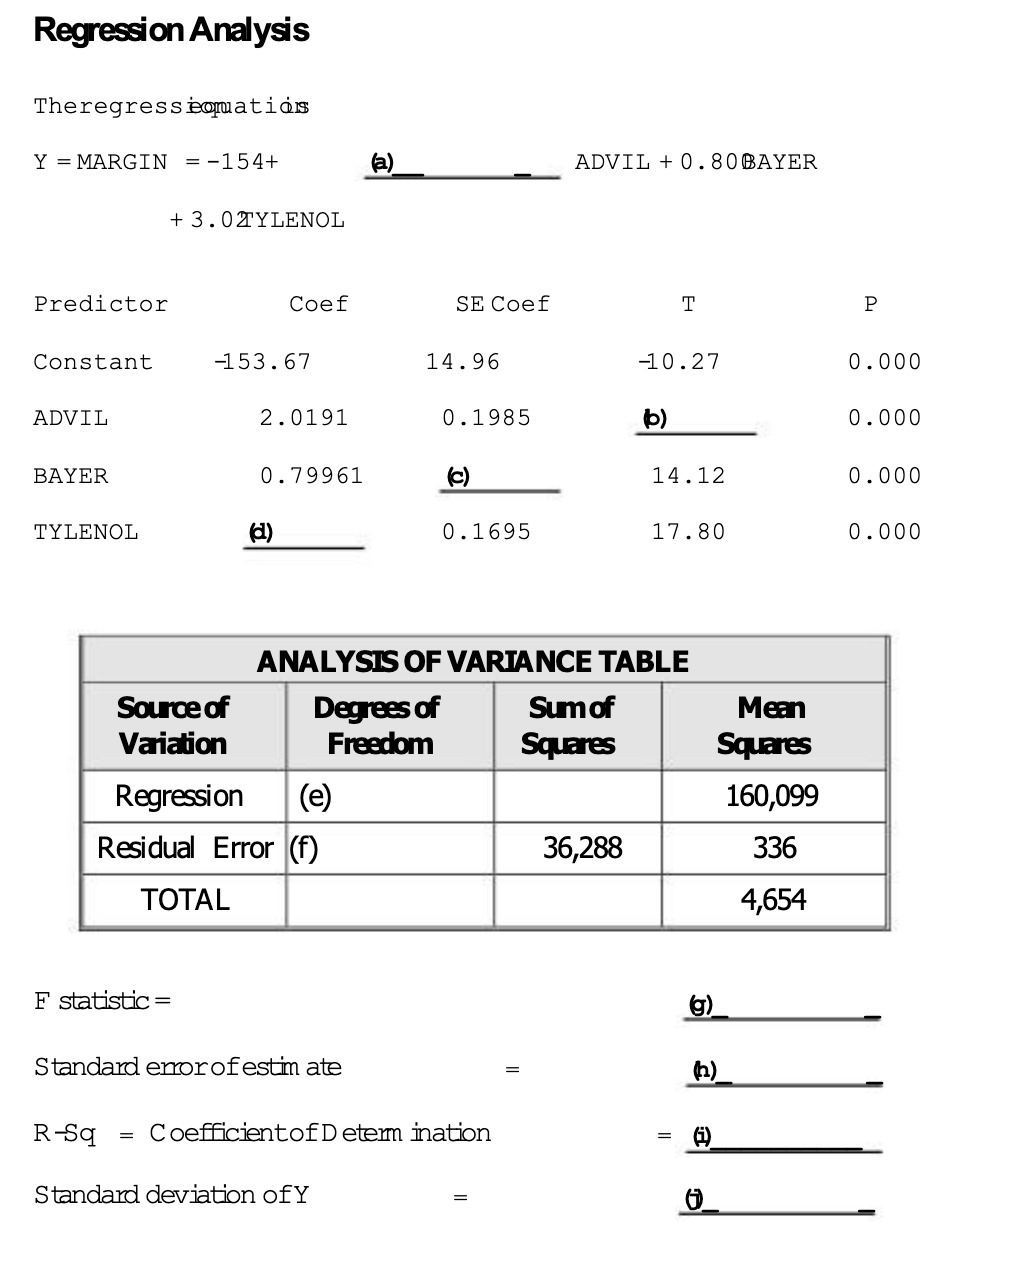
Regression Analysis The regressiomations Y MARGIN = -154+ (a) ADVIL +0.80BAYER +3.0TYLENOL Predictor Coef SE Coef T P Constant -153.67 14.96 -10.27 0.000 ADVIL 2.0191 0.1985 (b) 0.000 BAYER TYLENOL 0.79961 (c) 14.12 0.000 (d) 0.1695 17.80 0.000 Source of Variation Regression ANALYSIS OF VARIANCE TABLE Degrees of Freedom (e) Residual Error (f) TOTAL F statistic = Standard error of estimate Sum of Squares Mean Squares 160,099 36,288 336 4,654 (g) (h) R-Sq = Coefficient of Determination (i) Standard deviation of Y ()
Step by Step Solution
There are 3 Steps involved in it
1 Expert Approved Answer
Step: 1 Unlock

Question Has Been Solved by an Expert!
Get step-by-step solutions from verified subject matter experts
Step: 2 Unlock
Step: 3 Unlock