

Question: Regression by Excel 1. Based on the data available in the slides, Estimate the multivariate equation econometrically using excel. 2. Interpret the results ( coefficient,
Regression by Excel 1. Based on the data available in the slides, Estimate the multivariate equation econometrically using excel. 2. Interpret the results ( coefficient, adjusted R square, p-values) 3. Write the hypothesis for each independent variable. 4. Derive the elasticities for each variable using excel.

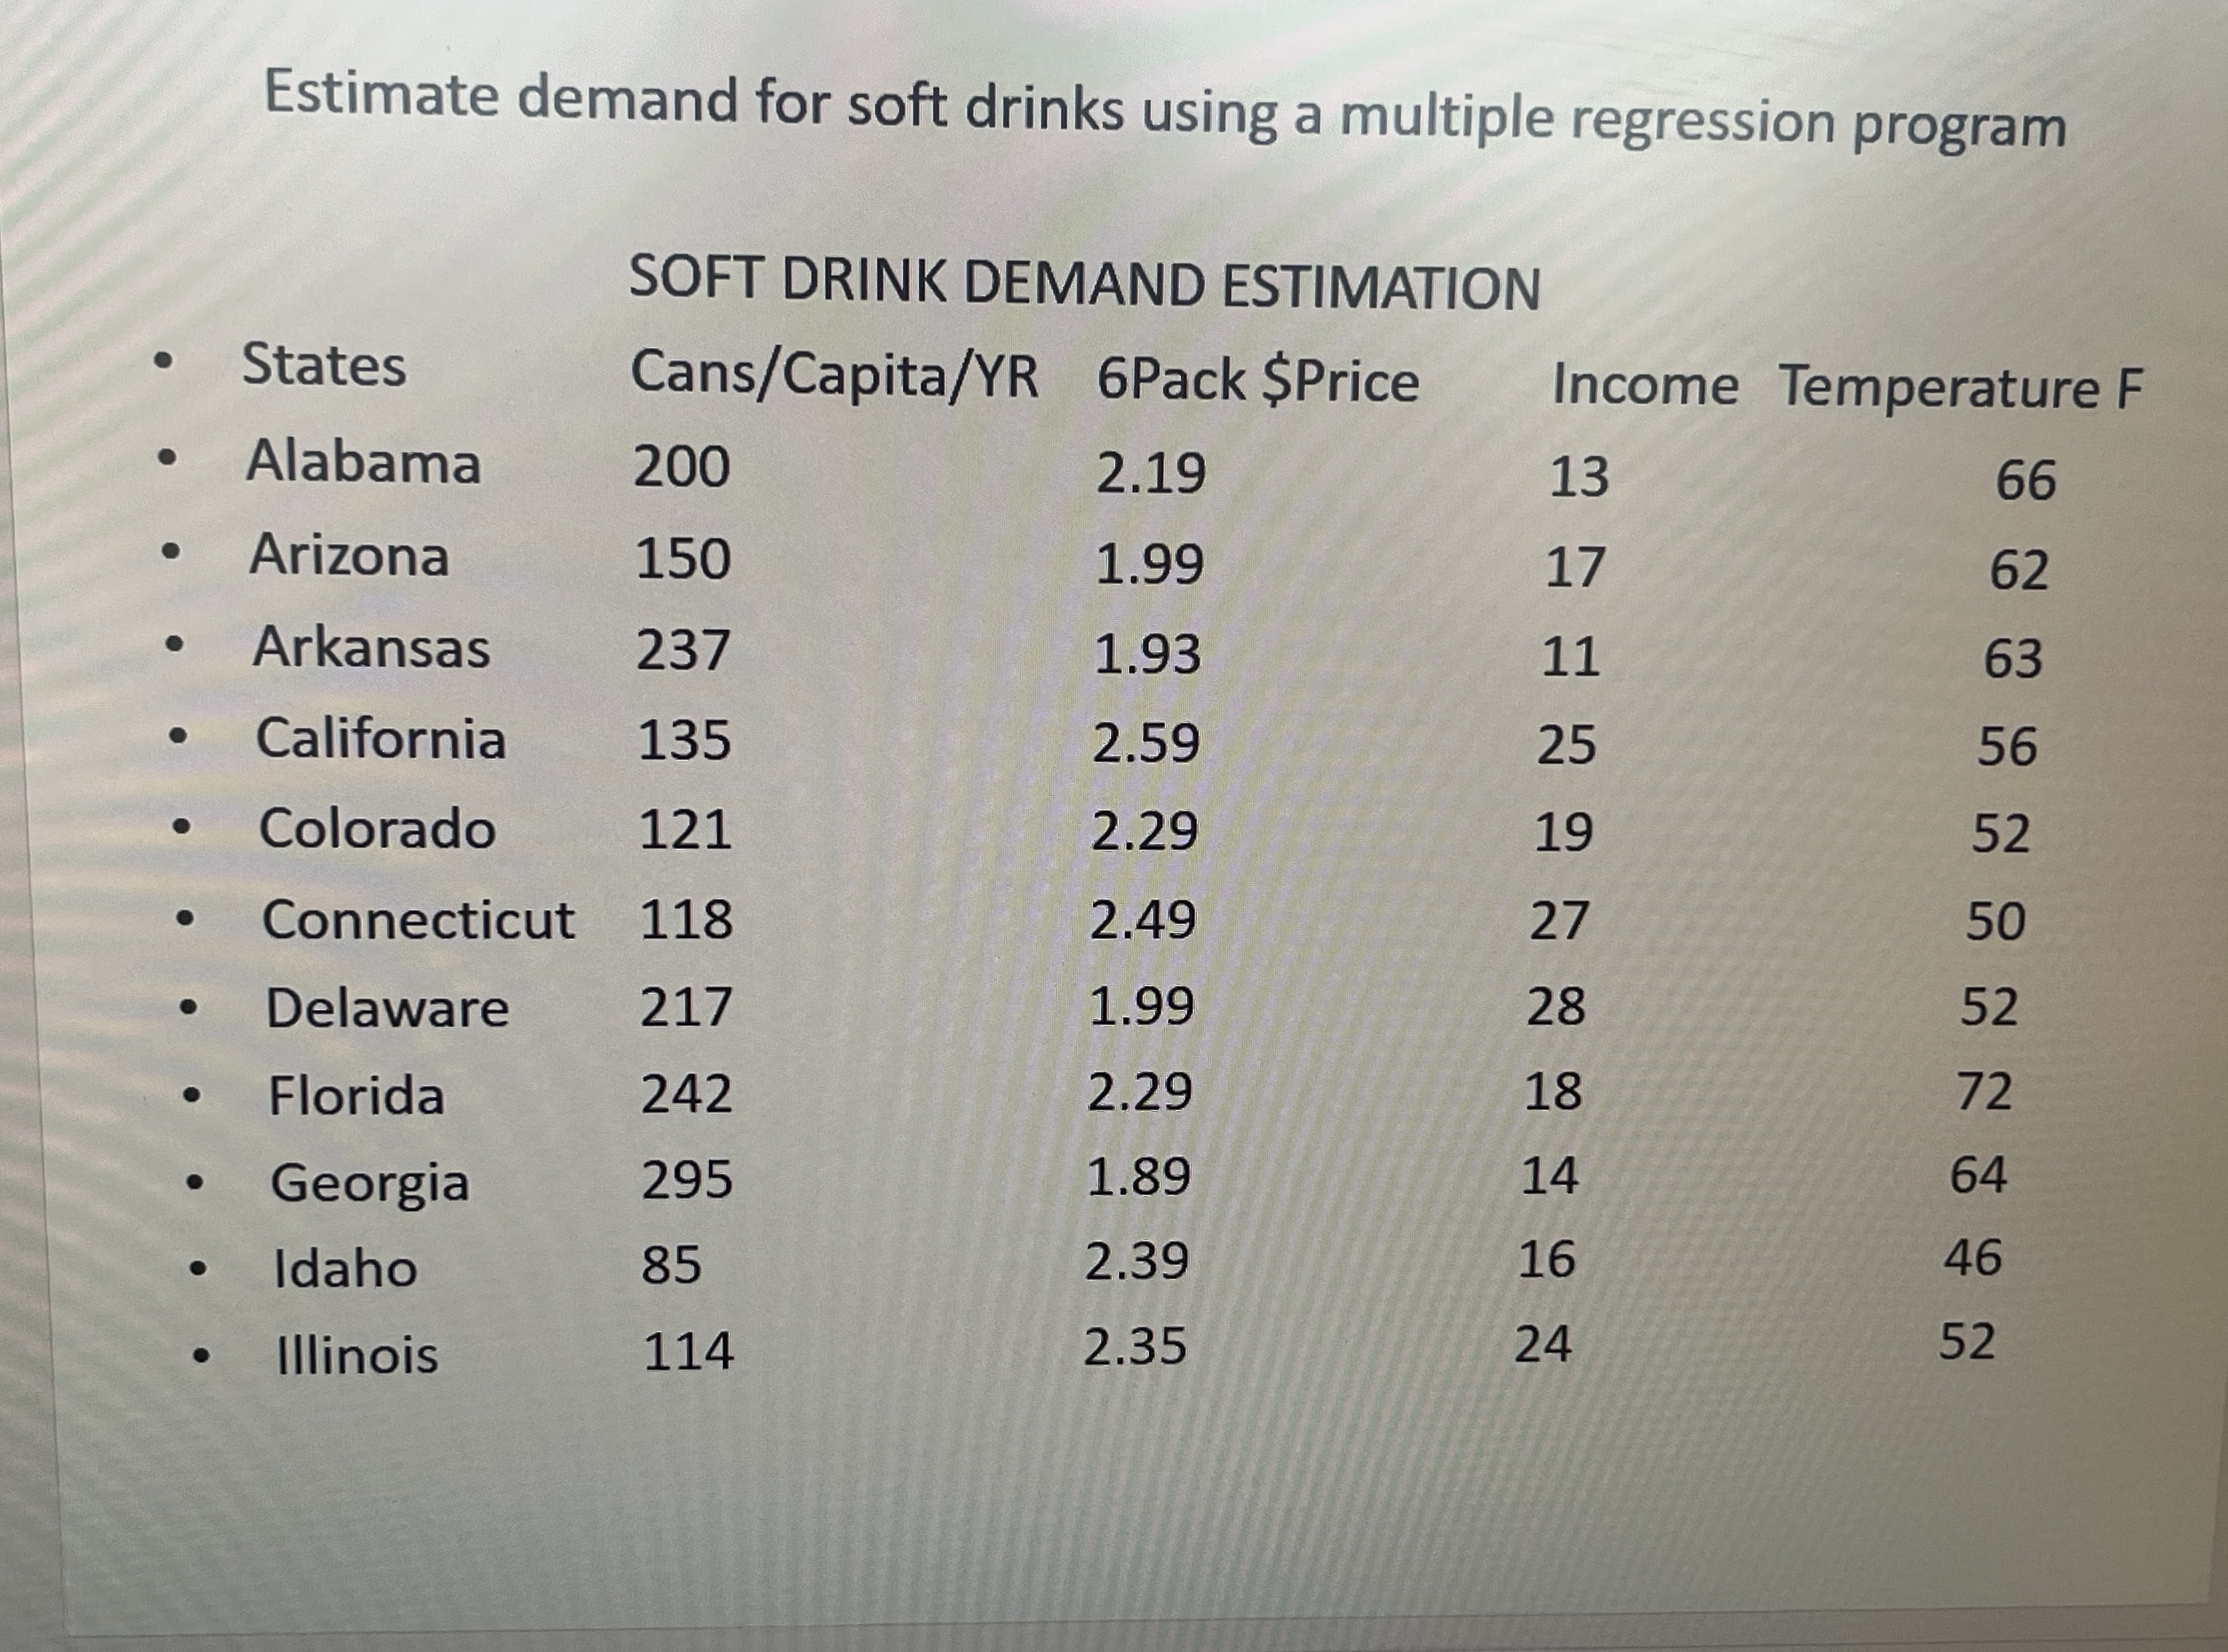
Estimate demand for soft drinks using a multiple regression program SOFT DRINK DEMAND ESTIMATION . States Cans/Capita/YR 6Pack $Price Income Temperature F . Alabama 200 2.19 13 66 . Arizona 150 1.99 17 62 . Arkansas 237 1.93 11 63 . California 135 2.59 25 56 . Colorado 121 2.29 19 52 Connecticut 118 2.49 27 50 . Delaware 217 1.99 28 52 . Florida 242 2.29 18 72 Georgia 295 1.89 14 64 . Idaho 85 2.39 16 46 . Illinois 114 2.35 24 52
Step by Step Solution
There are 3 Steps involved in it

Get step-by-step solutions from verified subject matter experts