

Question: Regression Explanatory variable [Comrad Experience Experience Pes Dal Duck Darce De AP Number of observations Durida-Walmar Statistic (4) Coeffieat (t-value) 0.315 (-a) 7.2138 (2010)
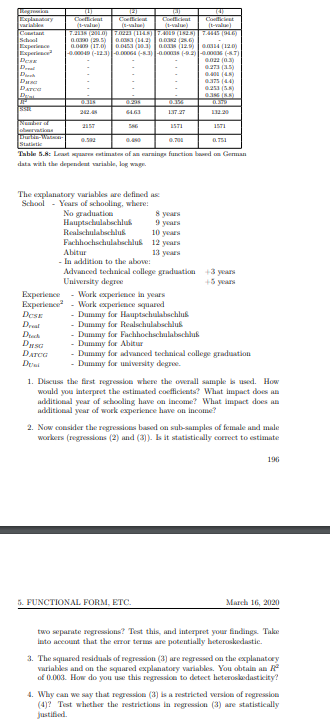
Regression Explanatory variable [Comrad Experience Experience Pes Dal Duck Darce De AP Number of observations Durida-Walmar Statistic (4) Coeffieat (t-value) 0.315 (-a) 7.2138 (2010) 02 (25) 7.0223 (114.8) 7.4019 (1828)|| 7.4445 (946) | 0.0083 (14.2) 02 (286) 0.000 (17.00) 0.0453 (10.3 (129) 0.00114 (120) -0.00049 (-12.3)-0.00064 (-53)-000S (-2)-000036 (87) 0.022 (0.3) (15) 64.63 SAG (3) Coefficial The explanatory variables are defined as School - Years of schooling, where: No graduation Hauptschulabschlu Realschulabschlus Fachhochschulabschlu 0316 137.27 1571 8 years 9 years 10 years 12 years 13 years Abitur - In addition to the above: Advanced technical college graduation University degree 0.700 0.751 Table 5.8: Letares estimates of an earnings function based on German data with the dependent variable, log wage. Experience - Work experience in years Experience - Work experience squared DESE - Dummy for Hauptschulabschlus Dreal - Dummy for Realschulabschlu Duck Dusc DATCO Di Coefficient (-) - Dummy for Fachhochschulabschlu - Dummy for Abitur 5. FUNCTIONAL FORM, ETC. 0.273 0.000 (48) 0.375 (44) 03 (8) 0.379 132.20 1571 +3 years +5 years - Dummy for advanced technical college graduation - Dummy for university degree. 1. Discuss the first regression where the overall sample is used. How would you interpret the estimated coefficients? What impact does an additional year of schooling have on income? What impact does an additional year of work experience have on income? 2. Now consider the regressions based on sub-samples of female and male workers (regressions (2) and (3)). Is it statistically correct to estimate 196 March 16, 2020 two separate regressions? Test this, and interpret your findings. Take into account that the error terms are potentially heteroskedastic. 3. The squared residuals of regression (3) are regressed on the explanatory variables and on the squared explanatory variables. You obtain an R of 0.003. How do you use this regression to detect heteroskodasticity? 4. Why can we say that regression (3) is a restricted version of regression (4)? Test whether the restrictions in regression (3) are statistically justified.
Step by Step Solution
3.41 Rating (154 Votes )
There are 3 Steps involved in it
Analysis of the German Data 1 Regression with Overall Sample The first regression uses the entire sample of workers male and female to estimate the impact of education and work experience on income Th... View full answer

Get step-by-step solutions from verified subject matter experts