

Question: Regression resultsdincomeCoef.RobustStd. Err.tP > | t | [ 9 5 % Conf.Intervagender#empstatFemale#formal - 4 8 1 . 5 9 5 5 3 9 . 9
Regression resultsdincomeCoef.RobustStd. Err.tP t Conf.Intervagender#empstatFemale#formalFemale#informalMale#informalagecat to years to years to years years and moreeducatSecondary schoolHigh schoolMore than high schoolcons
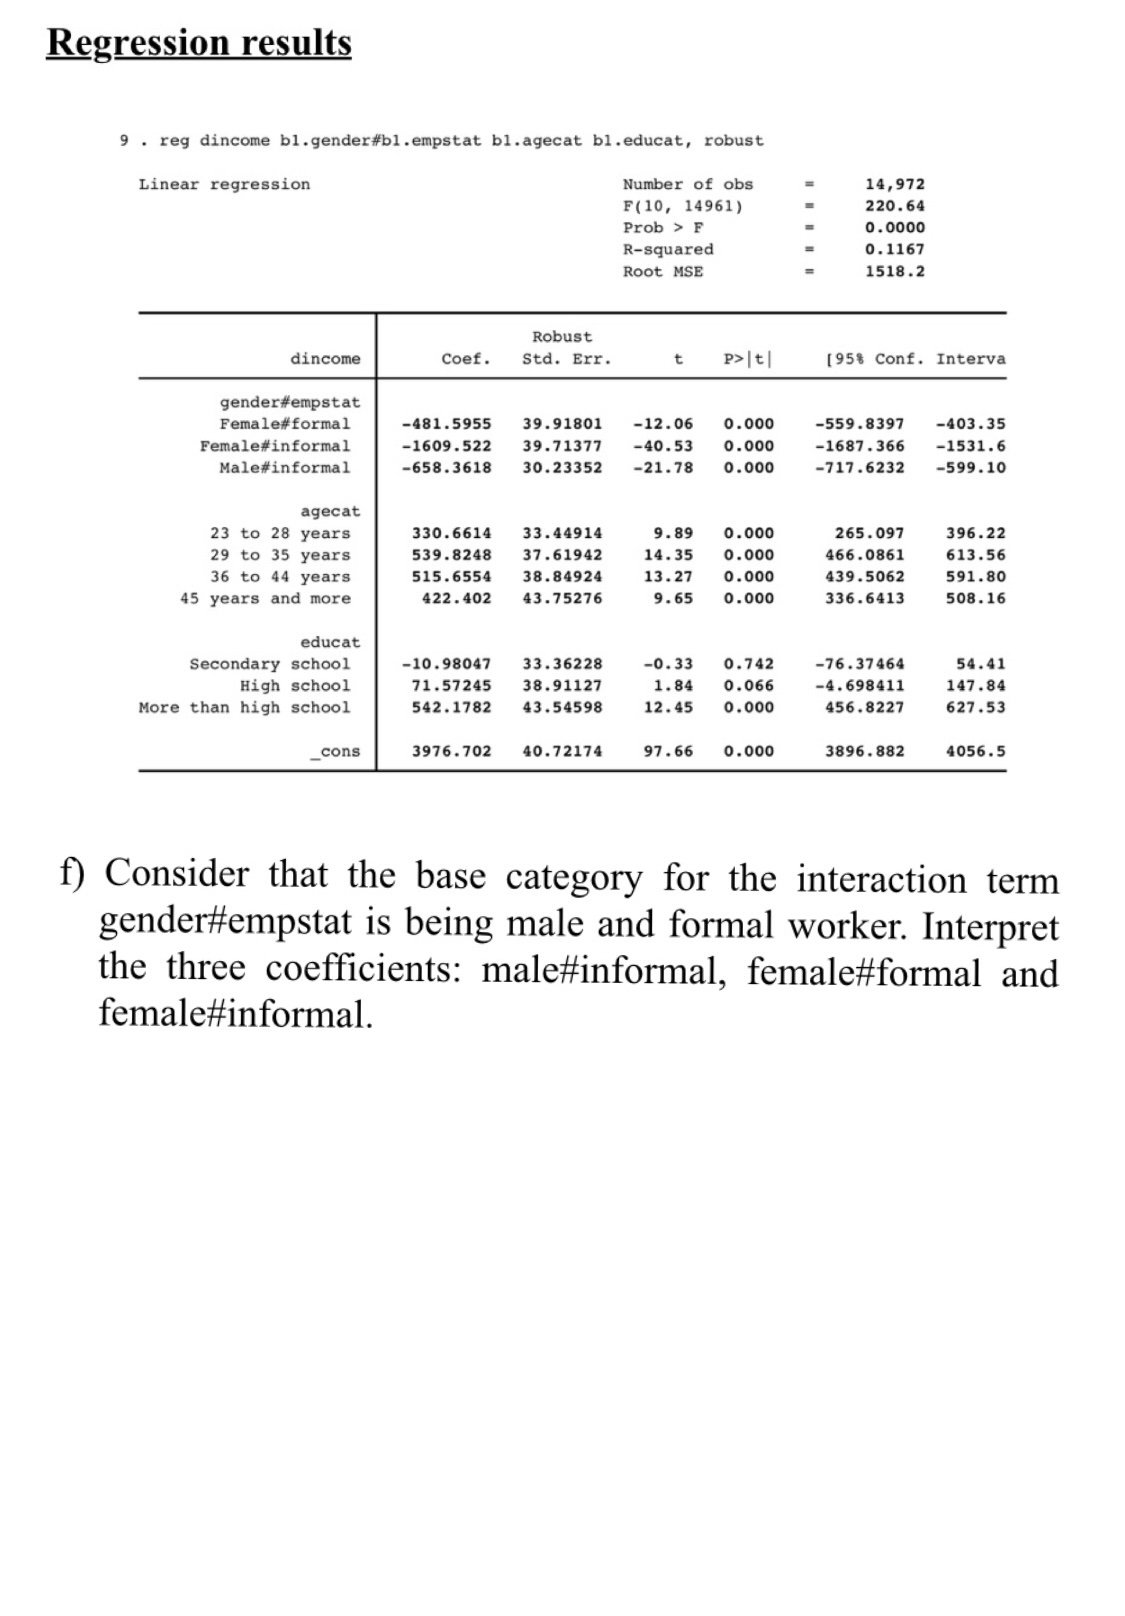
f Consider that the base category for the interaction term gender#empstat is being male and formal worker. Interpret the three coefficients: male#informal, female#formal and female#informal.
Step by Step Solution
There are 3 Steps involved in it
1 Expert Approved Answer
Step: 1 Unlock

Question Has Been Solved by an Expert!
Get step-by-step solutions from verified subject matter experts
Step: 2 Unlock
Step: 3 Unlock