

Question: Regression Statistics Multiple R 0.53003249 R Square X Adjusted R Square 0.66289897 Standard Error 0.06157645 Observations 39 ANOVA df SS Regression 1 0.231008 (SSR -
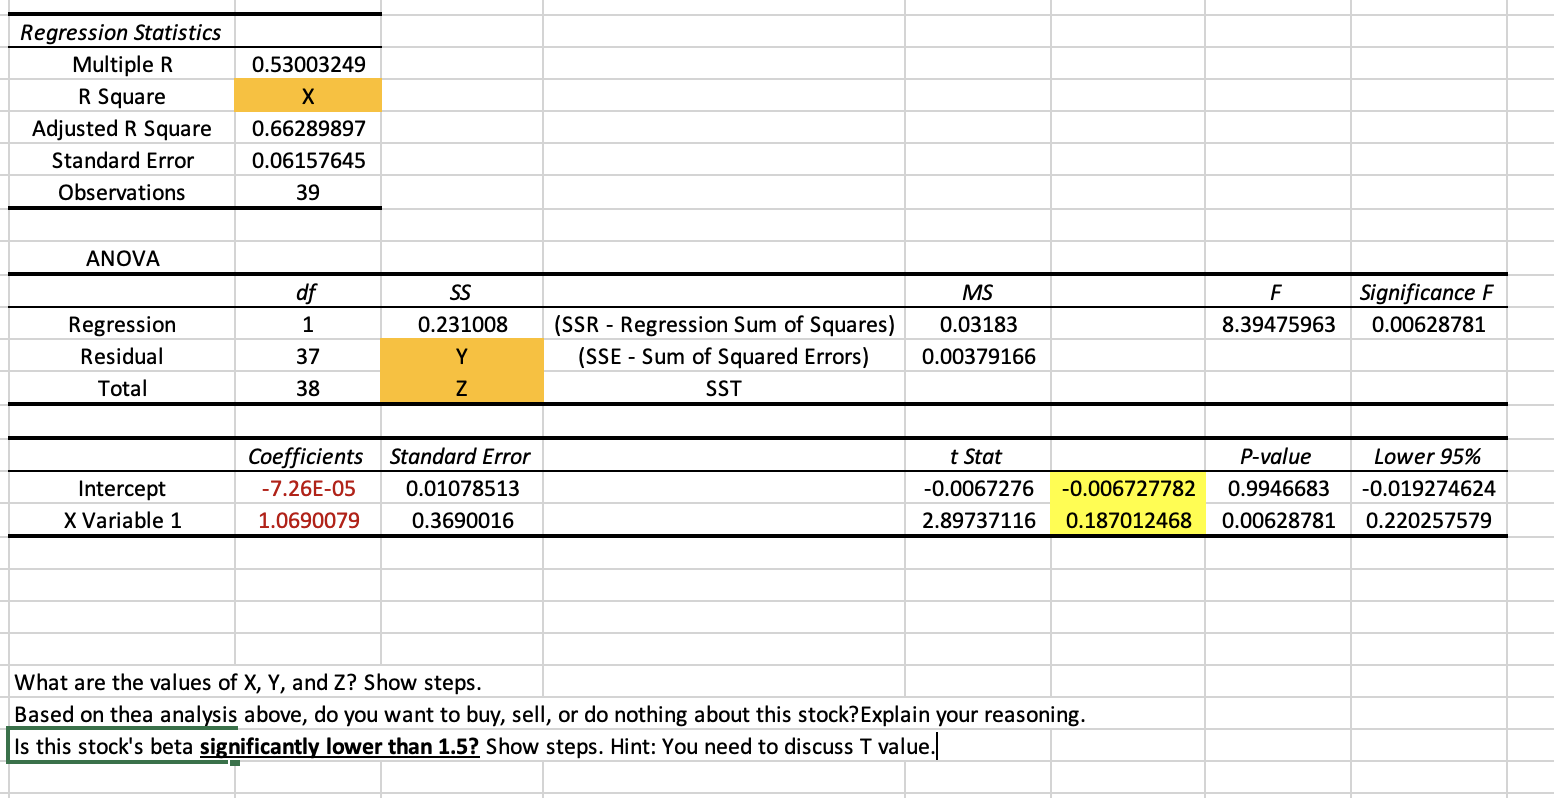
Regression Statistics Multiple R 0.53003249 R Square X Adjusted R Square 0.66289897 Standard Error 0.06157645 Observations 39 ANOVA df SS Regression 1 0.231008 (SSR - Regression Sum of Squares) Residual 37 Y (SSE - Sum of Squared Errors) SST Total 38 Z Coefficients Standard Error Intercept -7.26E-05 0.01078513 X Variable 1 1.0690079 0.3690016 What are the values of X, Y, and Z? Show steps. Based on thea analysis above, do you want to buy, sell, or do nothing about this stock? Explain your reasoning. Is this stock's beta significantly lower than 1.5? Show steps. Hint: You need to discuss T value. MS 0.03183 F 8.39475963 Significance F 0.00628781 0.00379166 Lower 95% t Stat P-value -0.0067276 -0.006727782 0.9946683 -0.019274624 2.89737116 0.187012468 0.00628781 0.220257579 Regression Statistics Multiple R 0.53003249 R Square X Adjusted R Square 0.66289897 Standard Error 0.06157645 Observations 39 ANOVA df SS Regression 1 0.231008 (SSR - Regression Sum of Squares) Residual 37 Y (SSE - Sum of Squared Errors) SST Total 38 Z Coefficients Standard Error Intercept -7.26E-05 0.01078513 X Variable 1 1.0690079 0.3690016 What are the values of X, Y, and Z? Show steps. Based on thea analysis above, do you want to buy, sell, or do nothing about this stock? Explain your reasoning. Is this stock's beta significantly lower than 1.5? Show steps. Hint: You need to discuss T value. MS 0.03183 F 8.39475963 Significance F 0.00628781 0.00379166 Lower 95% t Stat P-value -0.0067276 -0.006727782 0.9946683 -0.019274624 2.89737116 0.187012468 0.00628781 0.220257579
Step by Step Solution
There are 3 Steps involved in it

Get step-by-step solutions from verified subject matter experts