

Question: Regression Statistics Multiple R 0.86 R Square 0.75 Adjusted R Square 0.70 Standard Error 174.75 Observations 7 ANOVA df SS MS F Significance F 0.0122
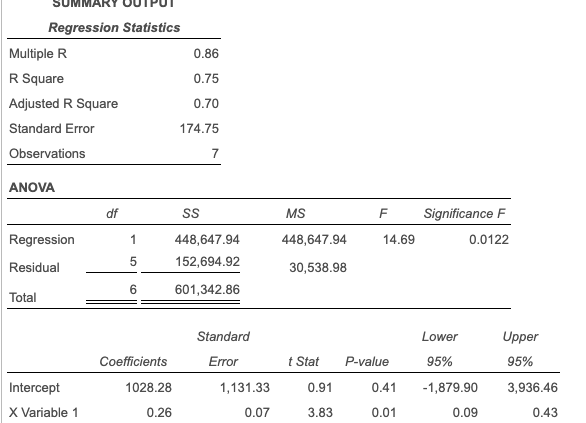
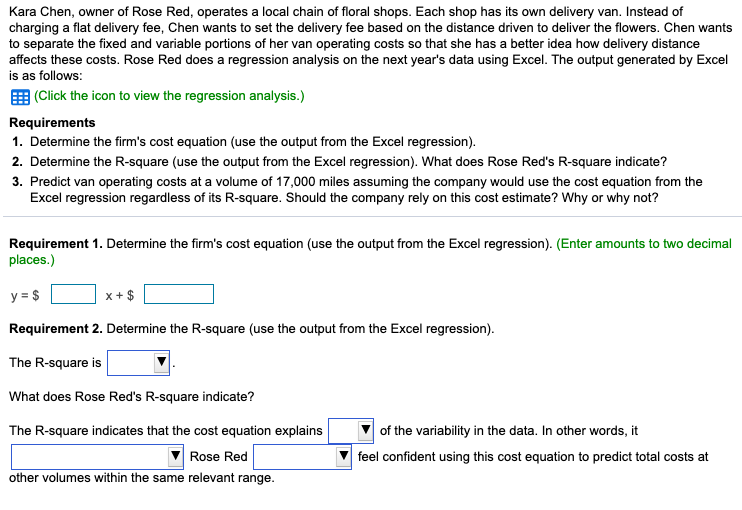
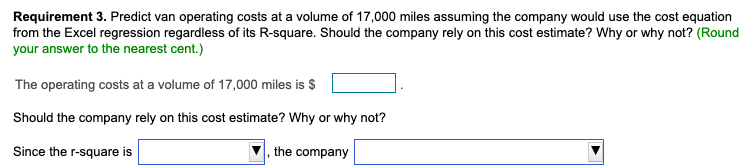
Regression Statistics Multiple R 0.86 R Square 0.75 Adjusted R Square 0.70 Standard Error 174.75 Observations 7 ANOVA df SS MS F Significance F 0.0122 1 448,647.94 14.69 Regression Residual 448,647.94 152,694.92 5 30,538.98 6 Total 601,342.86 Lower Upper Standard Error Coefficients t Stat P-value 95% 95% 1028.28 1,131.33 0.91 0.41 -1,879.90 3,936.46 Intercept X Variable 1 0.26 0.07 3.83 0.01 0.09 0.43 Kara Chen, owner of Rose Red, operates a local chain of floral shops. Each shop has its own delivery van. Instead of charging a flat delivery fee, Chen wants to set the delivery fee based on the distance driven to deliver the flowers. Chen wants to separate the fixed and variable portions of her van operating costs so that she has a better idea how delivery distance affects these costs. Rose Red does a regression analysis on the next year's data using Excel. The output generated by Excel is as follows: (Click the icon to view the regression analysis.) Requirements 1. Determine the firm's cost equation (use the output from the Excel regression). 2. Determine the R-square (use the output from the Excel regression). What does Rose Red's R-square indicate? 3. Predict van operating costs at a volume of 17,000 miles assuming the company would use the cost equation from the Excel regression regardless of its R-square. Should the company rely on this cost estimate? Why or why not? Requirement 1. Determine the firm's cost equation (use the output from the Excel regression). (Enter amounts to two decimal places.) y = $ X + $ Requirement 2. Determine the R-square (use the output from the Excel regression). The R-square is What does Rose Red's R-square indicate? The R-square indicates that the cost equation explains Rose Red of the variability in the data. In other words, it feel confident using this cost equation to predict total costs at other volumes within the same relevant range. Requirement 3. Predict van operating costs at a volume of 17,000 miles assuming the company would use the cost equation from the Excel regression regardless of its R-square. Should the company rely on this cost estimate? Why or why not? (Round your answer to the nearest cent.) The operating costs at a volume of 17,000 miles is $ Should the company rely on this cost estimate? Why or why not? Since the r-square is the company
Step by Step Solution
There are 3 Steps involved in it

Get step-by-step solutions from verified subject matter experts