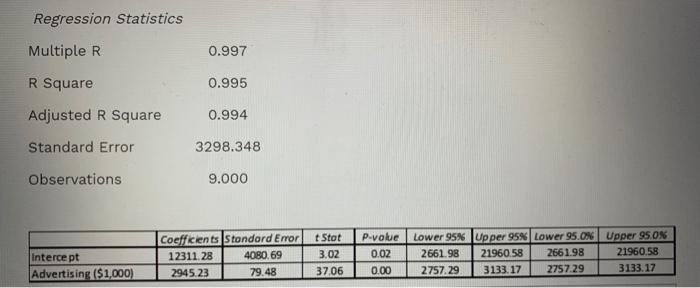
Question: Regression Statistics Multiple R 0.997 R Square 0.995 Adjusted R Square 0.994 Standard Error 3298.348 Observations 9.000 Intercept Advertising ($1,000) Coefficients Stonderd Error 12311.28 4080.69

Regression Statistics Multiple R 0.997 R Square
Regression Statistics Multiple R 0.997 R Square 0.995 Adjusted R Square 0.994 Standard Error 3298.348 Observations 9.000 Intercept Advertising ($1,000) Coefficients Stonderd Error 12311.28 4080.69 2945.23 79.48 Stot 3.02 37.06 P-value 0.02 0.00 Lower 95% Upper 95% Lower 95.ON Upper 95.0% 2661.98 21960,58 2661.98 21960.58 2757.29 3133.17 2757.29 3133.17 Advertising ($1,000) Line Fit Plot 250.000 200,000 150.000 Sales 100,000 Sales funt Predicted units 0 10 20 60 70 10 50 Advertising (1,000) PLEASE JUSTIFY YOUR RESULTS BELOW ACCORDING TO YOUR CALCULATIONS IF THERE IS ANY 1. What is the calculated equation from the data shown in the table above? 2. What is the nature and level of correlation? 3. What would be the estimated sales if $65,000 is invested in Advertisement? 4. According to the coofficient calculated, what is it saying in regard to the investment in advertisement and sales forecasting in dollars? 5. What can you conclude about the correlation between the amount invested in advertisement and sales forecasting in dollara

Step by Step Solution

There are 3 Steps involved in it

1 Expert Approved Answer
Step: 1 Unlock blur-text-image
Question Has Been Solved by an Expert!

Get step-by-step solutions from verified subject matter experts

Step: 2 Unlock
Step: 3 Unlock

Students Have Also Explored These Related General Management Questions!