

Question: Regression Use a scatterplot in order to explain the relationship between X and Y What do you expect for the sign of ?1 and magnitude
Regression
- Use a scatterplot in order to explain the relationship between X and Y
- What do you expect for the sign of ?1 and magnitude of ?2?
- After running the regression model in Minitab:
- What is the estimated regression equation?
- Interpret the estimate of ?0 in the words of the problem. Do the same for ? ?0 = 49.
- Conduct a test that the true slope of the model differs from 0.
- Explain how to use the output of the regression for the test.
- Relate the conclusion of your test to the scatterplot that you generated in (1)
- Use the generated plots of the regression model (histogram of the residuals) in order to check the normality assumption of your model. While there is no need for a statistical test, you must compare the shape to a normal distribution pdf.
- Generate the fitted line plot for this regression
- Generate prediction interval for y* and confidence interval for (?) when ?* = ??? (??? average of given x's). Note that ?* is a point in units that we are interested in predicting the Minutes for it. Here, as an example, we use ?? = 6 (average of column "unit") as x*. So in general you can pick any value for x*. For generating the intervals, we need to run the regression model again.
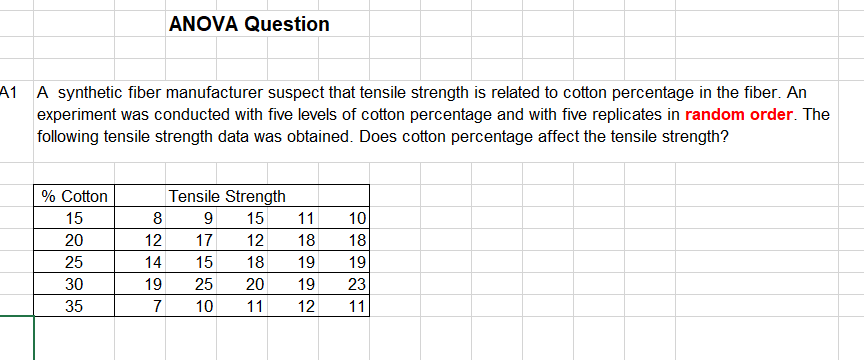
ANOVA Question 1311 A synthetic ber manufacturer suspect that tensile strength is related to cotton percentage in the ber. An experiment was conducted with ve levels of cotton percentage and with ve replicates in random order. The following tensile strength data was obtained. Does cotton percentage affect the tensile strength? % Cotton Tensile Strength 15 8 9 15 11 10 20 12 17 12 1B 18 25 14 15 18 19 19 30 19 25 20 19 23 35 7 10 11 12 11
Step by Step Solution
There are 3 Steps involved in it
1 Expert Approved Answer
Step: 1 Unlock

Question Has Been Solved by an Expert!
Get step-by-step solutions from verified subject matter experts
Step: 2 Unlock
Step: 3 Unlock