

Question: RegressionAnalysis explaining the following: o Which variables you identified as independent & dependent and why o Why you chose the trendline that you did o
RegressionAnalysis
explaining the following:
- o Which variables you identified as independent & dependent and why
- o Why you chose the trendline that you did
- o Interpret the meaning of the regression equation coefficients as well as the R2 value for
- the regression model you constructed
- -Compute the coefficient of correlation (r) for the two data sets using the CORREL() function
o Interpret the meaning of the correlation coefficient in the context of your study.
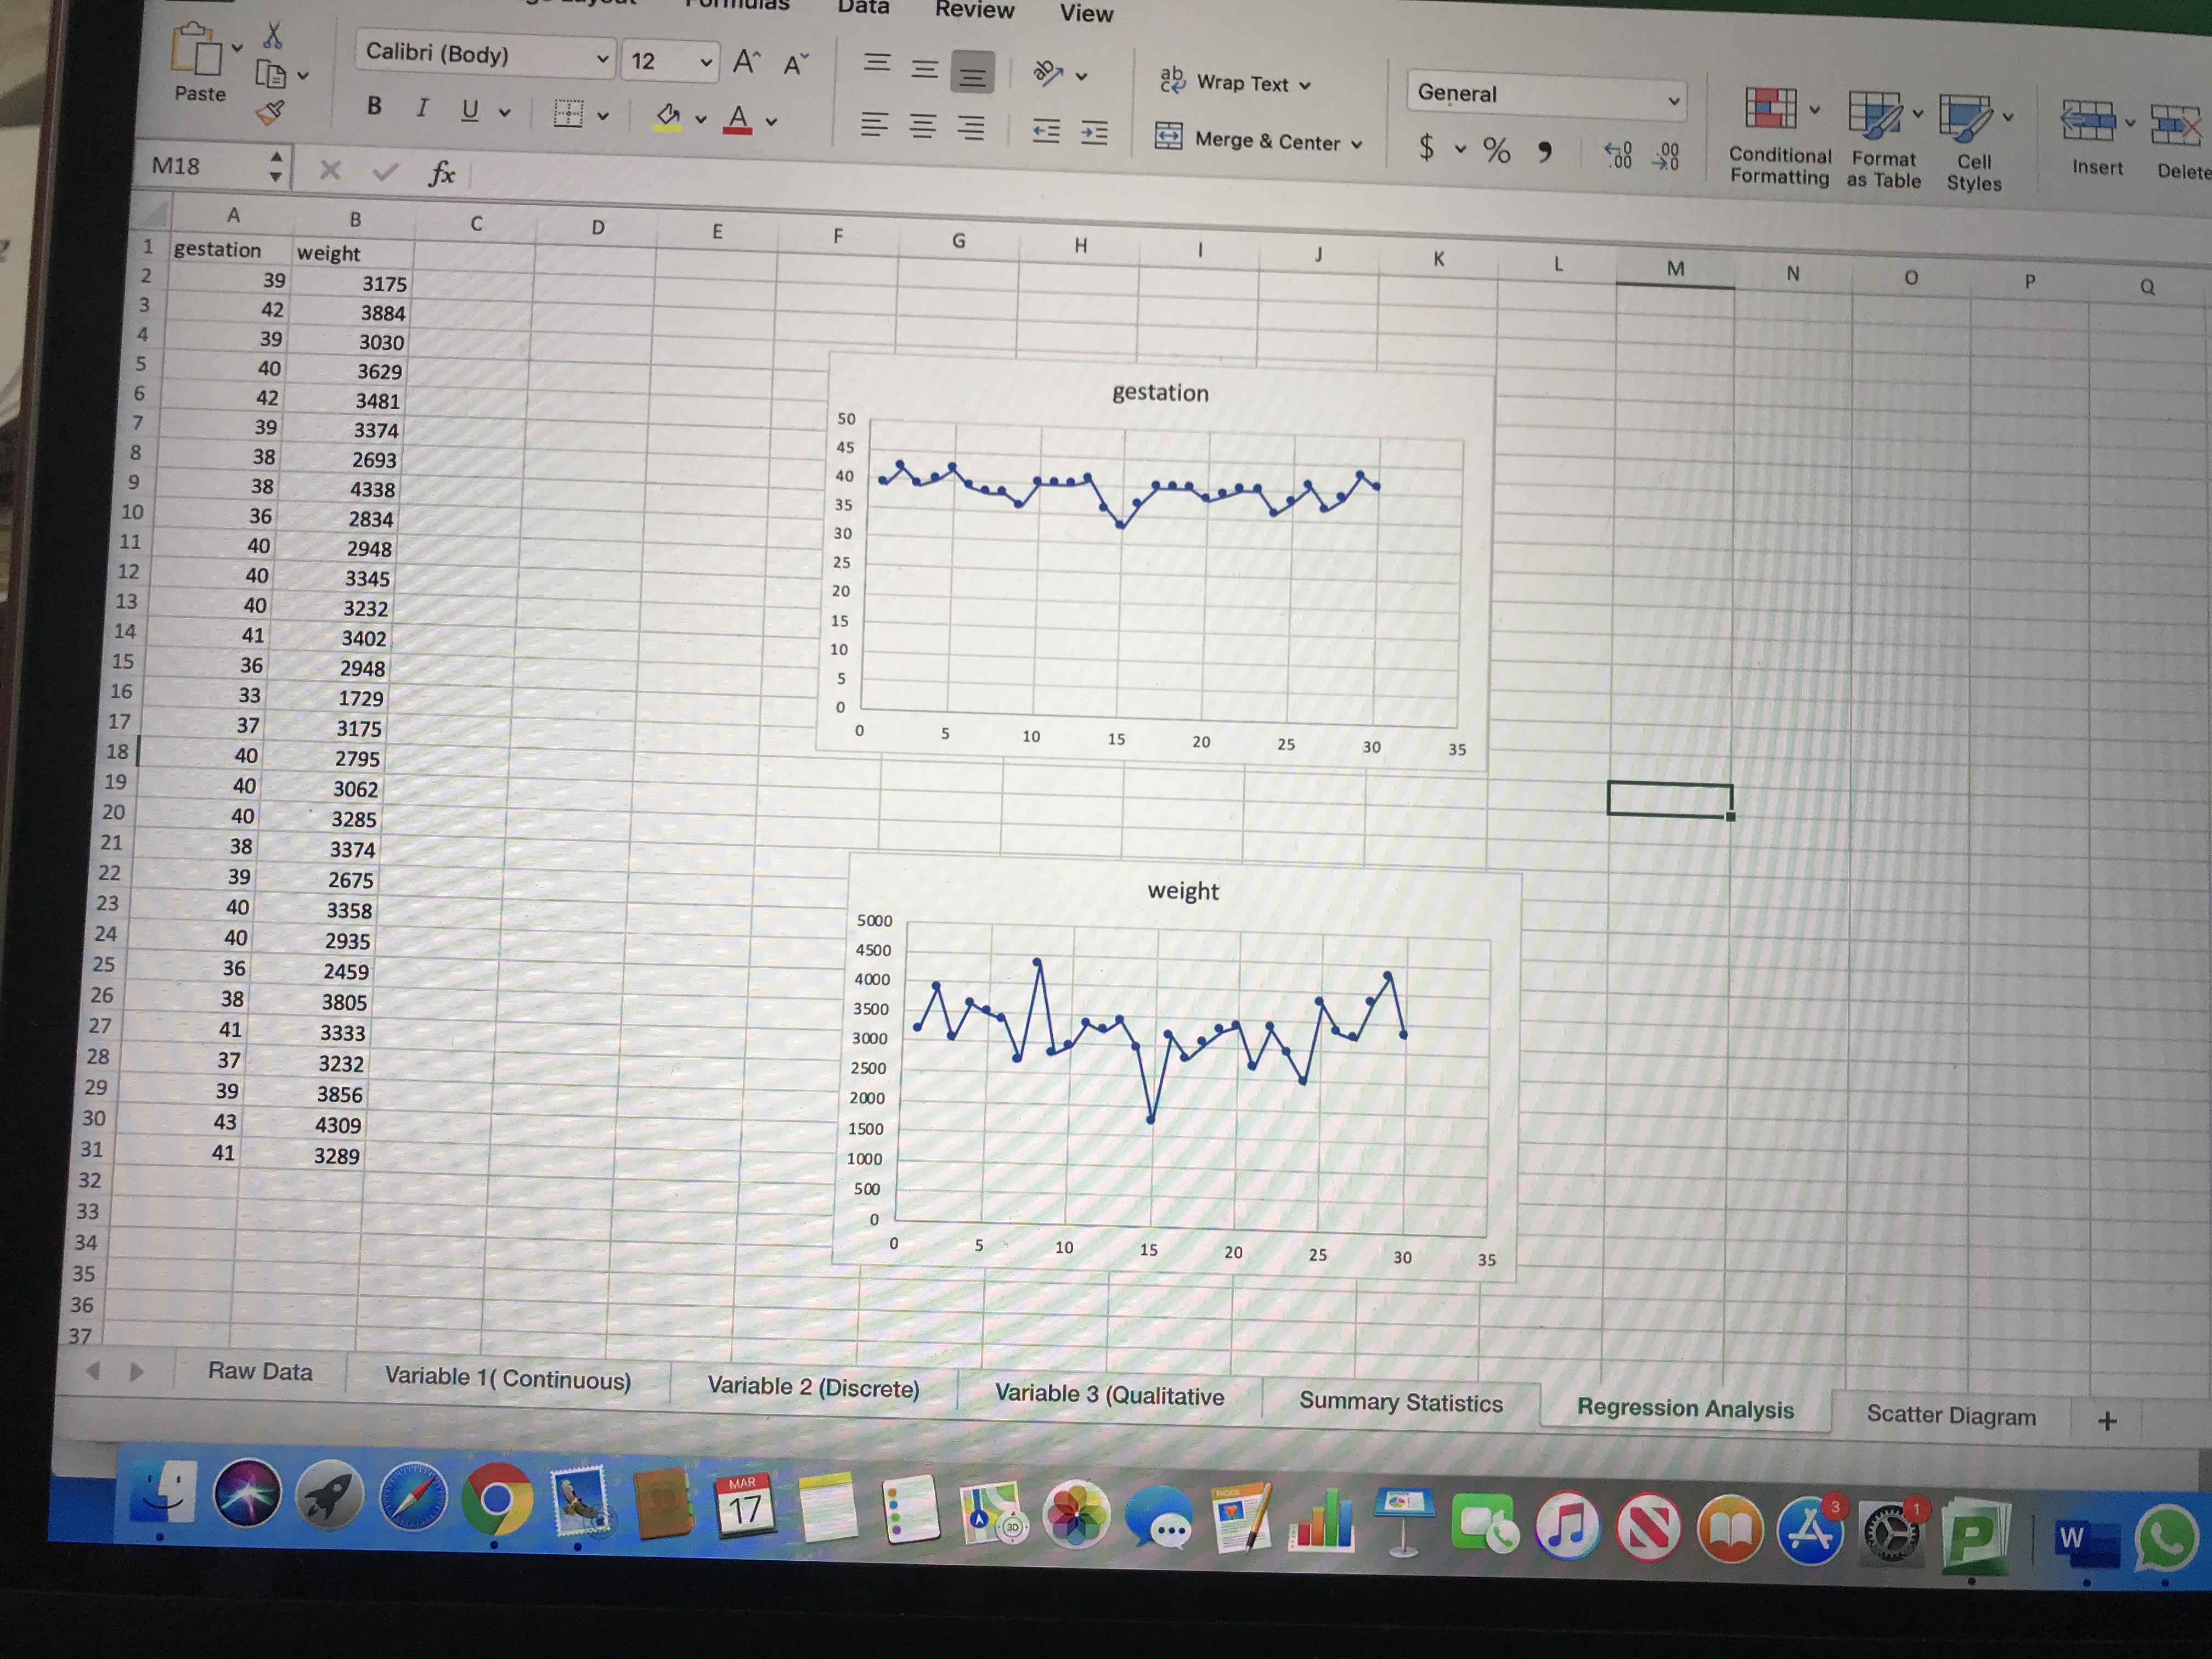
Review View Calibri (Body) v 12 ~ A" A " = ap Wrap Text v General Paste BI UVE = Merge & Center v $ ~ % $08 28 Conditional Format Cell Insert Formatting as Table Styles Delete M18 A B C D E F G H J K L M N O Q 1 TUI D WN gestation weight 39 3175 42 3884 39 3030 40 3629 gestation 42 3481 7 39 3374 50 8 38 2693 40 38 4338 10 36 2834 11 40 2948 12 40 3345 13 40 3232 14 41 3402 36 2948 33 1729 37 3175 5 10 15 20 25 30 35 40 2795 40 3062 40 3285 38 3374 39 2675 weight 40 3358 5000 24 40 2935 4500 25 36 2459 4000 26 38 3805 3500 27 41 3333 3000 28 37 3232 2500 29 39 3856 2000 30 43 4309 1500 31 41 3289 1000 32 500 33 0 5 15 34 10 20 25 30 35 35 36 37 4 D Raw Data Variable 1( Continuous) Variable 2 (Discrete) Variable 3 (Qualitative Summary Statistics Regression Analysis Scatter Diagram + MAR 1/ ... A P W
Step by Step Solution
There are 3 Steps involved in it

Get step-by-step solutions from verified subject matter experts