

Question: Relations between Financial Statements Prepare an analysis that explains the change in retained earnings from $85,777 million at the end of fiscal 2014 to $90,021
Relations between Financial Statements
Prepare an analysis that explains the change in retained earnings from $85,777 million at the end of fiscal 2014 to $90,021 million at the end of fiscal 2015. Do not be alarmed if your reconciliation is close to, but does not exactly equal, the $90,021 million ending balance. Please add an explanation to the process.
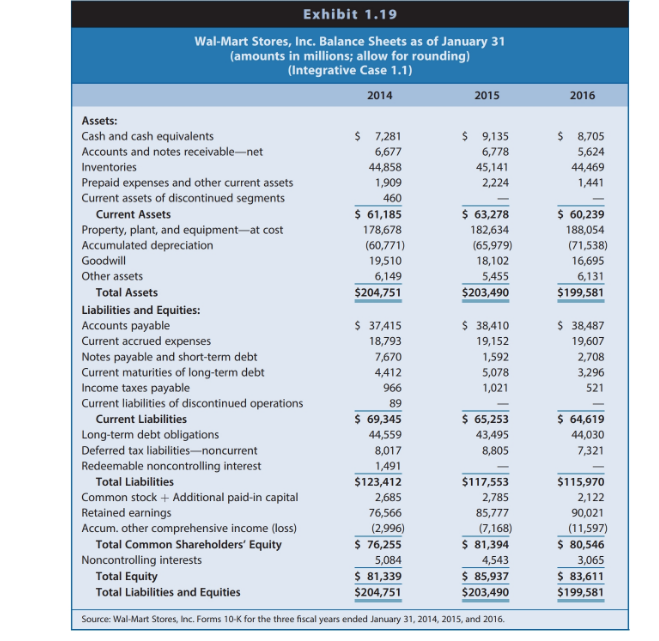
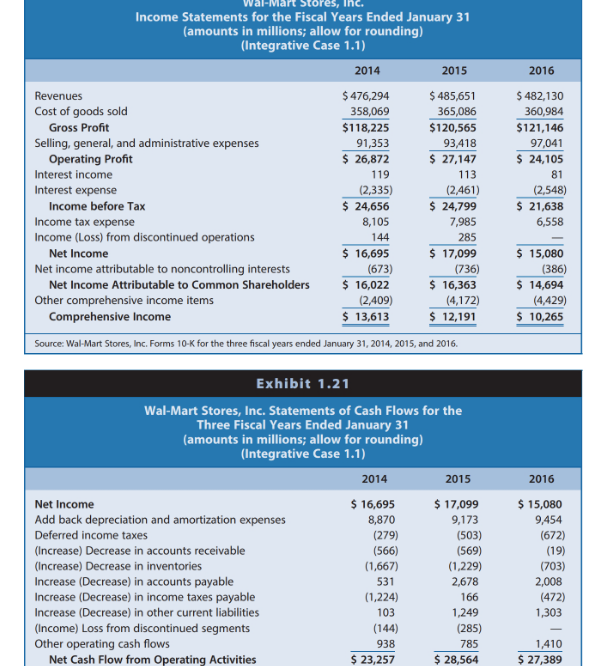
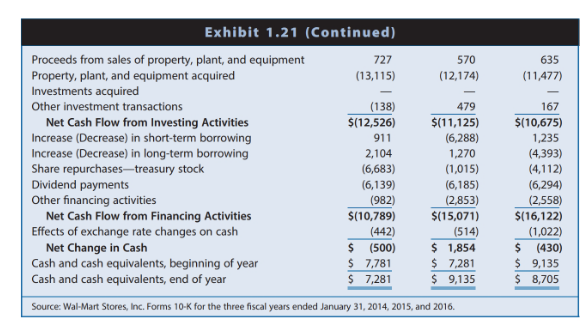
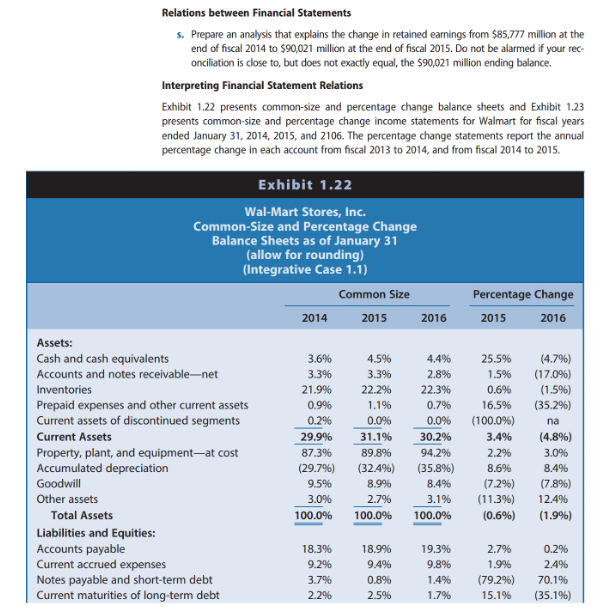
2016 $ 8,705 5,624 44,469 1,441 $ 60,239 188,054 (71,538) 16,695 6,131 $199,581 Exhibit 1.19 Wal-Mart Stores, Inc. Balance Sheets as of January 31 (amounts in millions; allow for rounding) (Integrative Case 1.1) 2014 2015 Assets: Cash and cash equivalents $ 7,281 $ 9,135 Accounts and notes receivable-net 6,677 6,778 Inventories 44,858 45,141 Prepaid expenses and other current assets 1,909 2,224 Current assets of discontinued segments 460 Current Assets $ 61,185 $ 63,278 Property, plant, and equipment-at cost 178,678 182,634 Accumulated depreciation (60,771) (65,979) Goodwill 19,510 18,102 Other assets 6,149 5,455 Total Assets $204,751 $203,490 Liabilities and Equities: Accounts payable $ 37,415 $ 38,410 Current accrued expenses 18,793 19,152 Notes payable and short-term debt 7,670 1,592 Current maturities of long-term debt 4,412 5,078 Income taxes payable 966 1,021 Current liabilities of discontinued operations 89 Current Liabilities $ 69,345 $ 65,253 Long-term debt obligations 44,559 43,495 Deferred tax liabilities-noncurrent 8,017 8,805 Redeemable noncontrolling interest 1,491 Total Liabilities $123,412 $117,553 Common stock + Additional paid-in capital 2,685 2,785 Retained earnings 76,566 85,777 Accum. other comprehensive income (loss) (2,996) (7,168) Total Common Shareholders' Equity $ 76,255 $ 81,394 Noncontrolling interests 5,084 4,543 Total Equity $ 81,339 $ 85,937 Total Liabilities and Equities $204,751 $203,490 Source: Wal-Mart Stores, Inc. Forms 10-K for the three fiscal years ended January 31, 2014, 2015, and 2016. $ 38,487 19,607 2,708 3,296 521 $ 64,619 44,030 7,321 $115,970 2,122 90,021 (11,597) $ 80,546 3,065 $ 83,611 $199,581 Wal-Me 2016 Stores, Income Statements for the Fiscal Years Ended January 31 (amounts in millions; allow for rounding) (Integrative Case 1.1) 2014 2015 Revenues $ 476,294 $ 485,651 Cost of goods sold 358,069 365,086 Gross Profit $118,225 $120,565 Selling, general, and administrative expenses 91,353 93,418 Operating Profit $ 26,872 $ 27,147 Interest income 119 113 Interest expense (2,335) (2,461) Income before Tax $ 24,656 $ 24,799 Income tax expense 8,105 7,985 Income (Loss) from discontinued operations Net Income $ 16,695 $ 17,099 Net income attributable to noncontrolling interests (673) (736) Net Income Attributable to Common Shareholders $ 16,022 $ 16,363 Other comprehensive income items (2,409) (4,172) Comprehensive Income $ 13,613 $ 12,191 Source: Wal-Mart Stores, Inc. Forms 10-K for the three fiscal years ended January 31, 2014, 2015, and 2016. $ 482,130 360,984 $121,146 97,041 $ 24,105 81 (2,548) $ 21,638 6,558 144 285 $ 15,080 (386) $ 14,694 (4,429) $ 10,265 2016 Exhibit 1.21 Wal-Mart Stores, Inc. Statements of Cash Flows for the Three Fiscal Years Ended January 31 (amounts in millions; allow for rounding) (Integrative Case 1.1) 2014 2015 Net Income $ 16,695 $ 17,099 Add back depreciation and amortization expenses 8,870 9,173 Deferred income taxes (279) (503) (Increase) Decrease in accounts receivable (566) (569) (Increase) Decrease in inventories (1,667) (1,229) Increase (Decrease) in accounts payable 531 2,678 Increase (Decrease) in income taxes payable (1,224) Increase (Decrease) in other current liabilities 103 1,249 (Income) Loss from discontinued segments (144) (285) Other operating cash flows 938 785 Net Cash Flow from Operating Activities $ 23,257 $ 28,564 $ 15,080 9,454 (672) (19) (703) 2,008 (472) 1,303 166 1,410 $ 27,389 570 635 (11,477) Exhibit 1.21 (Continued) Proceeds from sales of property, plant, and equipment 727 Property, plant, and equipment acquired (13,115) (12,174) Investments acquired Other investment transactions (138) 479 Net Cash Flow from Investing Activities $(12,526) $(11,125) Increase (Decrease) in short-term borrowing 911 (6,288) Increase (Decrease) in long-term borrowing 2,104 1,270 Share repurchases-treasury stock (6,683) (1,015) Dividend payments (6,139) (6,185) Other financing activities (982) (2,853) Net Cash Flow from Financing Activities $(10,789) $(15,071) Effects of exchange rate changes on cash (442) (514) Net Change in Cash $ (500) $ 1,854 Cash and cash equivalents, beginning of year $ 7,781 $ 7,281 Cash and cash equivalents, end of year $ 7,281 $ 9,135 Source: Wal-Mart Stores, Inc. Forms 10-K for the three fiscal years ended January 31, 2014, 2015, and 2016 167 $(10,675) 1,235 (4,393) (4,112) (6,294) (2,558) $(16,122) (1,022) $ (430) $ 9,135 $ 8,705 Relations between Financial Statements s. Prepare an analysis that explains the change in retained earnings from $85,777 million at the end of fiscal 2014 to $90,021 million at the end of fiscal 2015. Do not be alarmed if your rec- onciliation is close to, but does not exactly equal, the $90,021 million ending balance. Interpreting Financial Statement Relations Exhibit 1.22 presents common-size and percentage change balance sheets and Exhibit 1.23 presents common-size and percentage change income statements for Walmart for fiscal years ended January 31, 2014, 2015, and 2106. The percentage change statements report the annual percentage change in each account from fiscal 2013 to 2014, and from fiscal 2014 to 2015 Percentage Change 2015 2016 Exhibit 1.22 Wal-Mart Stores, Inc. Common-Size and Percentage Change Balance Sheets as of January 31 (allow for rounding) (Integrative Case 1.1) Common Size 2014 2015 2016 Assets: Cash and cash equivalents 3.6% 4.5% 4.4% Accounts and notes receivable-net 3.3% 3.3% 2.8% Inventories 21.99 22.296 22.3% Prepaid expenses and other current assets 0.9% 1.1% 0.7% Current assets of discontinued segments 0.296 0.0% 0.0% Current Assets 29.9% 31.1% 30.2% Property, plant, and equipment-at cost 87.3% 89.8% 94.2% Accumulated depreciation (29.7%) (32.4%) (35.8%) Goodwill 9.5% 8.9% 8.4% Other assets 3.0% 2.7% 3.1% Total Assets 100.0% 100.0% 100.0% Liabilities and Equities: Accounts payable 18.3% 18.9% 19.3% Current accrued expenses 9.2% 9.4% 9.8% Notes payable and short-term debt 3.7% 0.8% 1.4% Current maturities of long-term debt 2.2% 2.5% 1.7% 25.5% 1.5% 0.6% 16.5% (100.0%) 3.4% 2.2% 8.6% (7.2%) (11.3%) (0.6%) (4.796) (17.0%) (1.5%) (35.2%) na (4.8%) 3.0% 8.4% (7.8%) 12.4% (1.9%) 2.7% 1.9% (79.2%) 15.1% 0.2% 2.4% 70.1% (35.1%)
Step by Step Solution
There are 3 Steps involved in it

Get step-by-step solutions from verified subject matter experts