

Question: Reliability Analysis Observations from life duration test of 12 components are shown in the table below. - Compute R(t),F(t), and H(t) in Excel. - Plot
Reliability Analysis
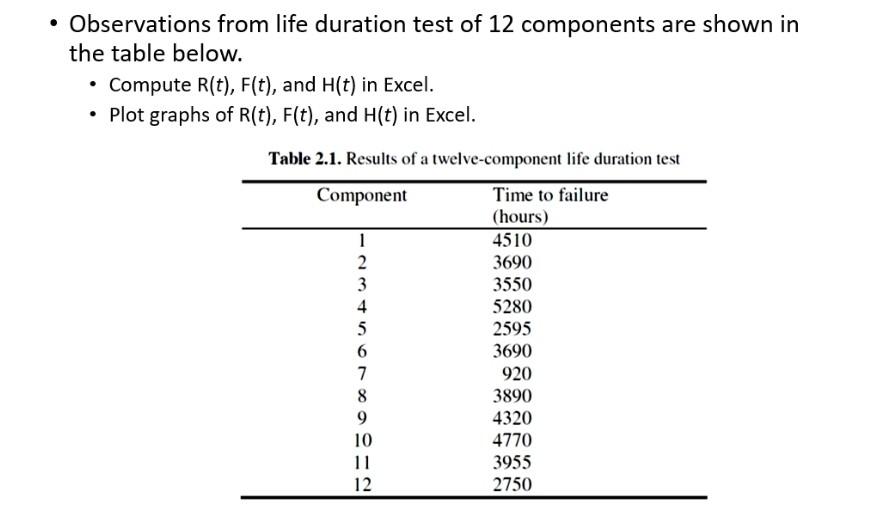
Observations from life duration test of 12 components are shown in the table below. - Compute R(t),F(t), and H(t) in Excel. - Plot graphs of R(t),F(t), and H(t) in Excel. Table 2.1. Results of a twelve-component life duration test
Step by Step Solution
There are 3 Steps involved in it
1 Expert Approved Answer
Step: 1 Unlock

Question Has Been Solved by an Expert!
Get step-by-step solutions from verified subject matter experts
Step: 2 Unlock
Step: 3 Unlock