

Question: Remaining Time: 55 minutes, 24 seconds. Question Completion Status: QUESTION 27 In the graph below, the area between the lines AC and OB after point
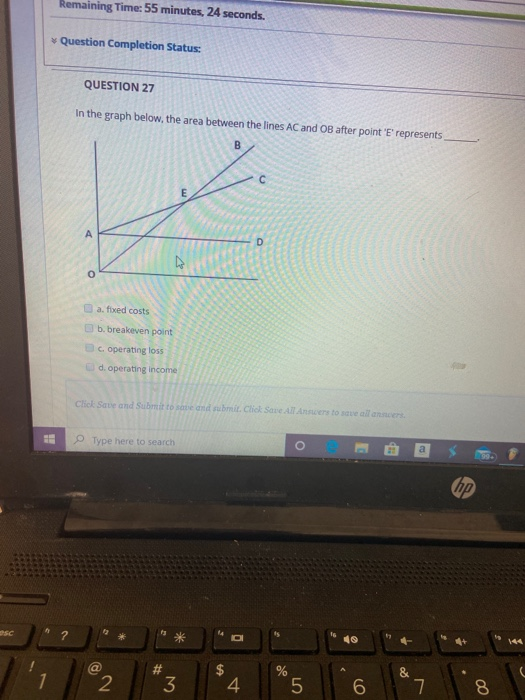
Remaining Time: 55 minutes, 24 seconds. Question Completion Status: QUESTION 27 In the graph below, the area between the lines AC and OB after point E represents a fixed costs b. breakeven point c. operating loss d. operating income Click Save and Submit to save and submit. Click Save All Amsten to all and Type here to search 8
Step by Step Solution
There are 3 Steps involved in it
1 Expert Approved Answer
Step: 1 Unlock

Question Has Been Solved by an Expert!
Get step-by-step solutions from verified subject matter experts
Step: 2 Unlock
Step: 3 Unlock