

Question: Remove the Legend from the chart and then add Data Labels formatted so that only the Category Name and Percentage display positioned in the Center.
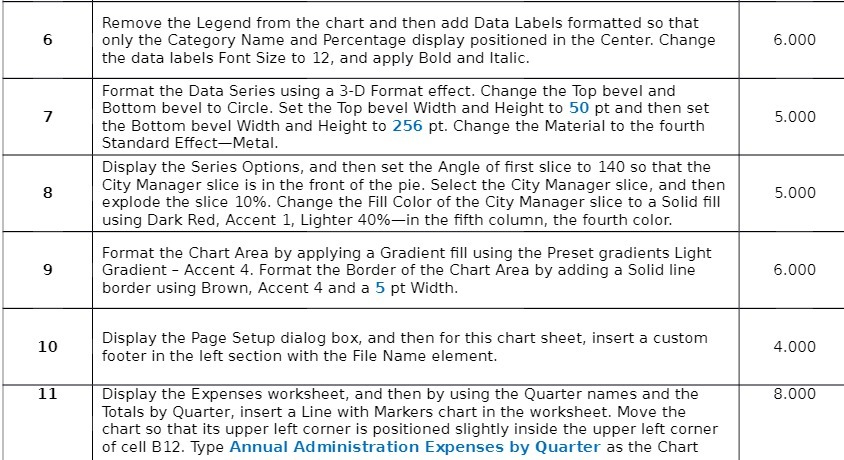

Remove the Legend from the chart and then add Data Labels formatted so that only the Category Name and Percentage display positioned in the Center. Change the data labels Font Size to 12. and apply Bold and Italic. l0.000 11 Format the Data Series using a 3-D Format effect. Change the Top bevel and Bottom bevel to Circle. Set the Top bevel Width and Height to 50 pt and then set the Bottom bevel Width and Height to 256 pt. Change the Material to the fourth Standard EffectMetal. Display the Series Options. and then set the Angle of rst slice to 140 so that the City Manager slice is in the front of the pie. Select the City Manager slice. and then explode the slice 10%. Change the Fill Color of the City Manager slice to a Solid ll using Dark Red. Accent 1. Lighter 40%in the fth column. the fourth color. Format the Chart Area by applying a Gradient ll using the Preset gradients Light Gradient Accent 4. Format the Border of the Chart Area by adding a Solid line border using Brown. Accent 4 and a 5 pt Width. Display the Page Setup dialog box. and then for this chart sheet. insert a custom footer in the left section with the File Name element. Display the Expenses worksheet. and then by using the Quarter names and the Totals by Quarter. insert a Line with Markers chart in the worksheet. Move the chart so that its upper left corner is positioned slightly inside the upper lelt corner of cell 012. Type Annual Administration Expenses by Quarter as the Chart 5.000 5.000 lE11000 4.000 8.000
Step by Step Solution
There are 3 Steps involved in it

Get step-by-step solutions from verified subject matter experts