

Question: Repeat for each frequency value appearing in the table and record the output voltages you see on the oscilloscope screen for each different frequency value.
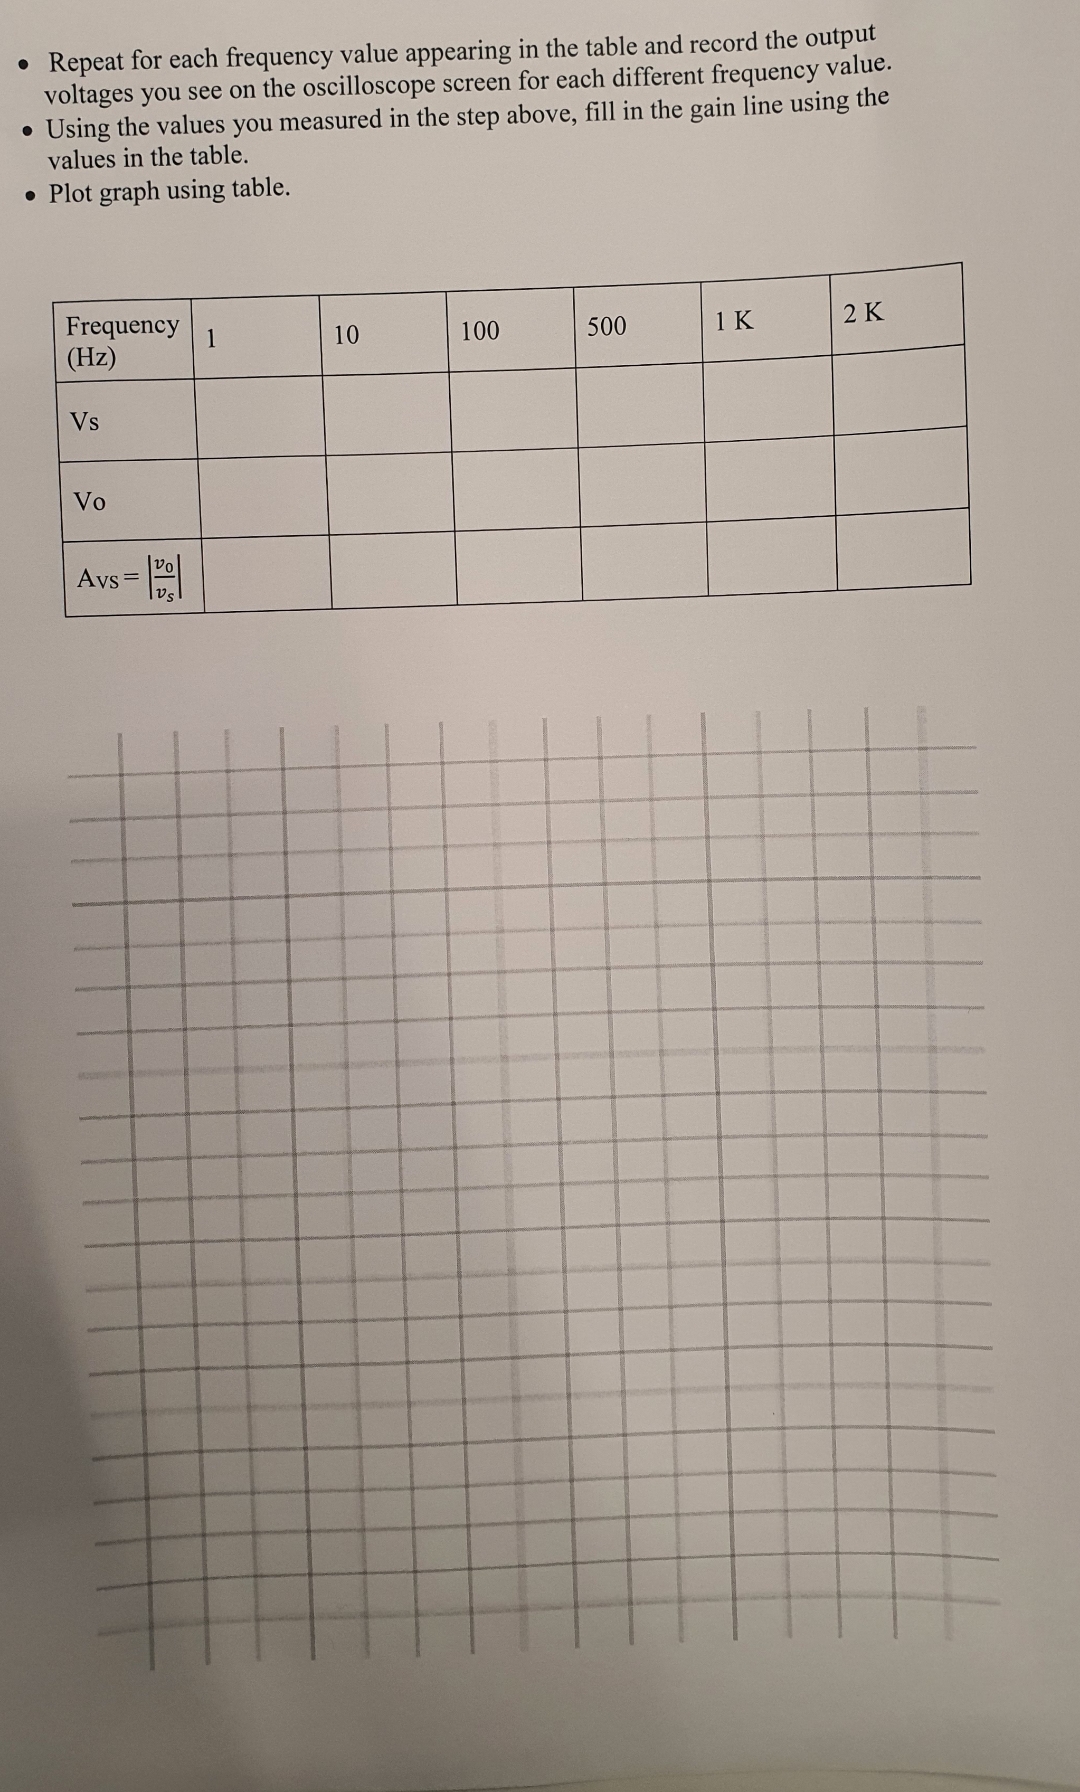
Repeat for each frequency value appearing in the table and record the output voltages you see on the oscilloscope screen for each different frequency value.
Using the values you measured in the step above, fill in the gain line using the values in the table.
Plot graph using table.
tabletableFrequency
Step by Step Solution
There are 3 Steps involved in it
1 Expert Approved Answer
Step: 1 Unlock

Question Has Been Solved by an Expert!
Get step-by-step solutions from verified subject matter experts
Step: 2 Unlock
Step: 3 Unlock