

Question: Repeat the computer experiment above, this time, however, positioning the two moons of Figure 1.8 to be on the edge of separability, that is, d
Repeat the computer experiment above, this time, however, positioning the two moons of Figure 1.8 to be on the edge of separability, that is, d = 0. Determine the classification error rate produced by the algorithm over 2,000 test data points.
Using Algorith below write a Matlab code to design this Perceptron 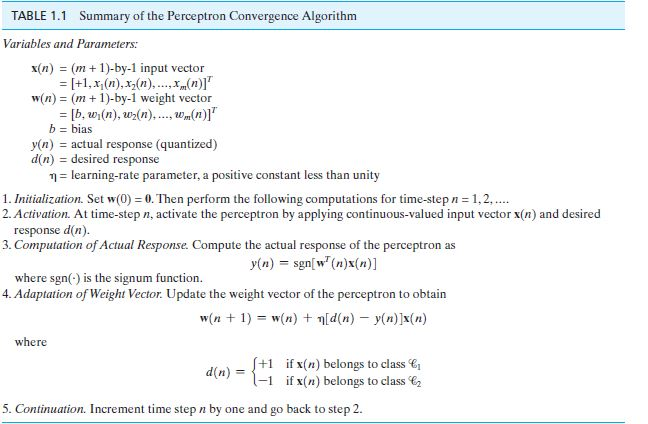
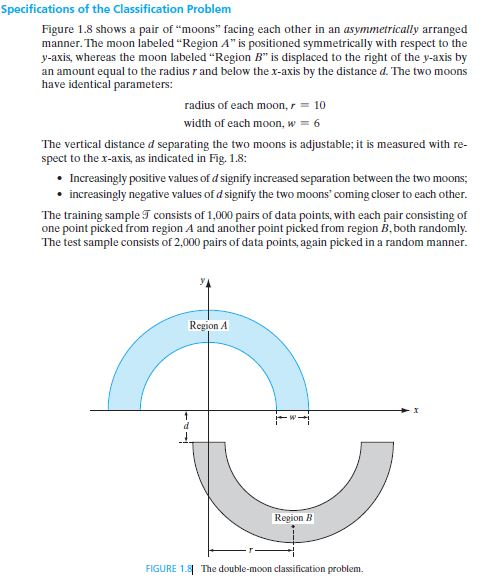
Specifications of the Classification Problem Figure 1.8 shows a pair of "moons" facing each other in an asymmetrically arranged manner. The moon labeled "Region A" is positioned symmetrically with respect to the y-axis, whereas the moon labeled "Region B" is displaced to the right of the y-axis by an amount equal to the radius r and below the x-axis by the distance d. The two moons have identical parameters: radius of each mo,r10 width of each moon, w 6 The vertical distance d separating the two moons is adjustable; it is measured with re- spect to the x-axis, as indicated in Fig. 1.8: Increasingly positive values of d signify increased separation between the two moons; increasingly negative values of d signify the two moons' coming closer to each other The training sample S consists of 1,000 pairs of data points, with each pair consisting of one point picked from region A and another point picked from region B,both randomly The test sample consists of 2,000 pairs of data points, again picked in a random manner. Region A Repion B FIGURE 1.8 The double-moon classification problem. Specifications of the Classification Problem Figure 1.8 shows a pair of "moons" facing each other in an asymmetrically arranged manner. The moon labeled "Region A" is positioned symmetrically with respect to the y-axis, whereas the moon labeled "Region B" is displaced to the right of the y-axis by an amount equal to the radius r and below the x-axis by the distance d. The two moons have identical parameters: radius of each mo,r10 width of each moon, w 6 The vertical distance d separating the two moons is adjustable; it is measured with re- spect to the x-axis, as indicated in Fig. 1.8: Increasingly positive values of d signify increased separation between the two moons; increasingly negative values of d signify the two moons' coming closer to each other The training sample S consists of 1,000 pairs of data points, with each pair consisting of one point picked from region A and another point picked from region B,both randomly The test sample consists of 2,000 pairs of data points, again picked in a random manner. Region A Repion B FIGURE 1.8 The double-moon classification
Step by Step Solution
There are 3 Steps involved in it

Get step-by-step solutions from verified subject matter experts