

Question: [Replace this text, including the brackets, with an introduction of the claim and the scenario of this hypothesis test. State your null and alternative

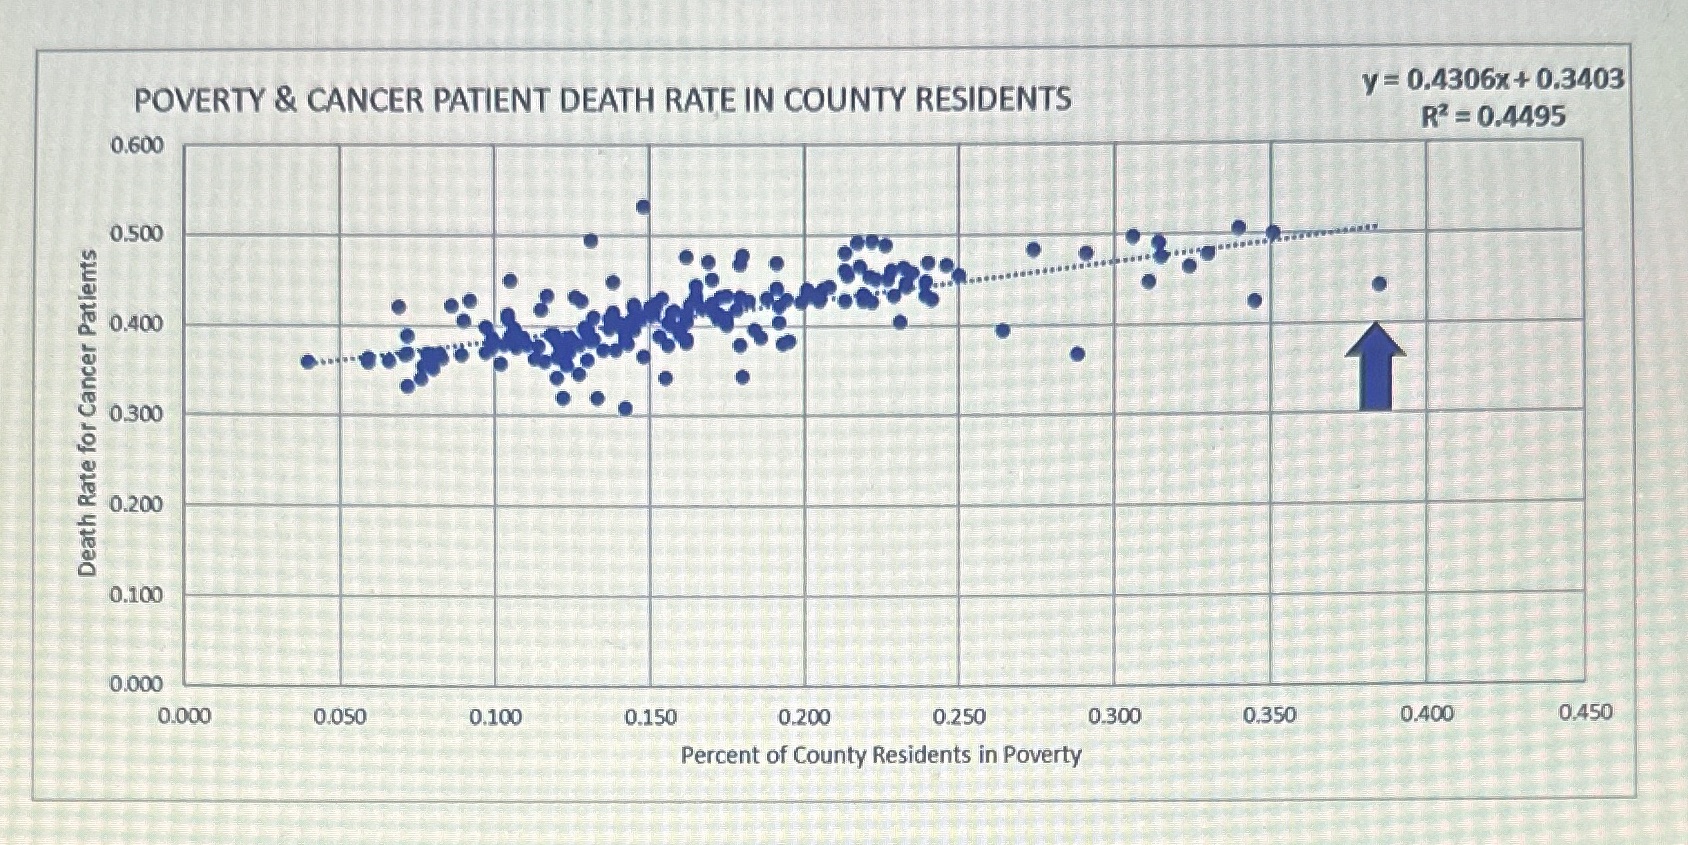
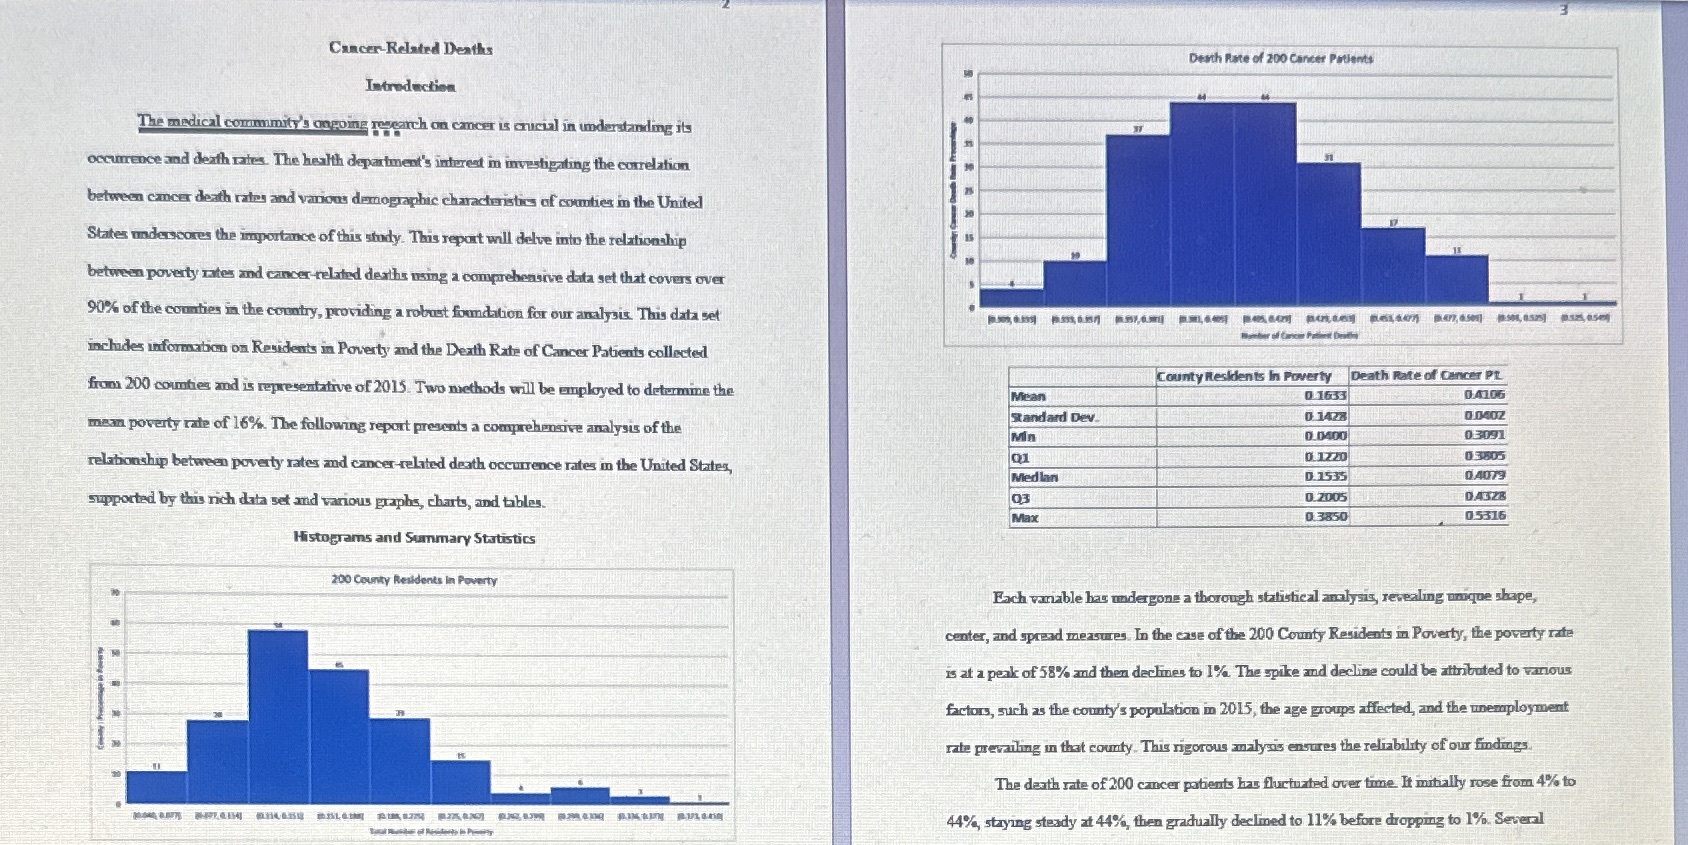
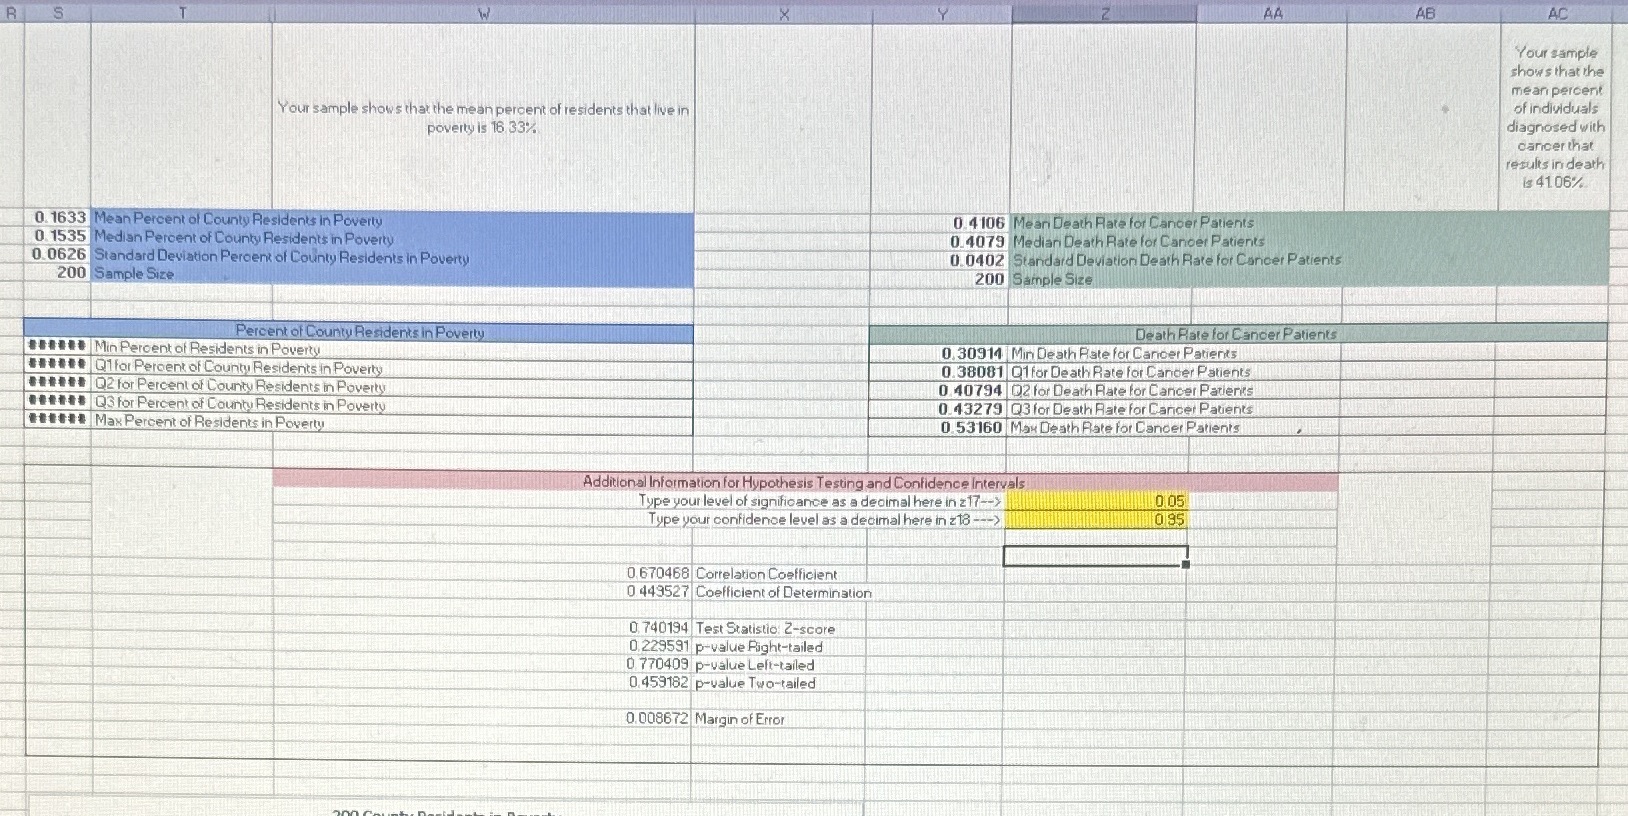
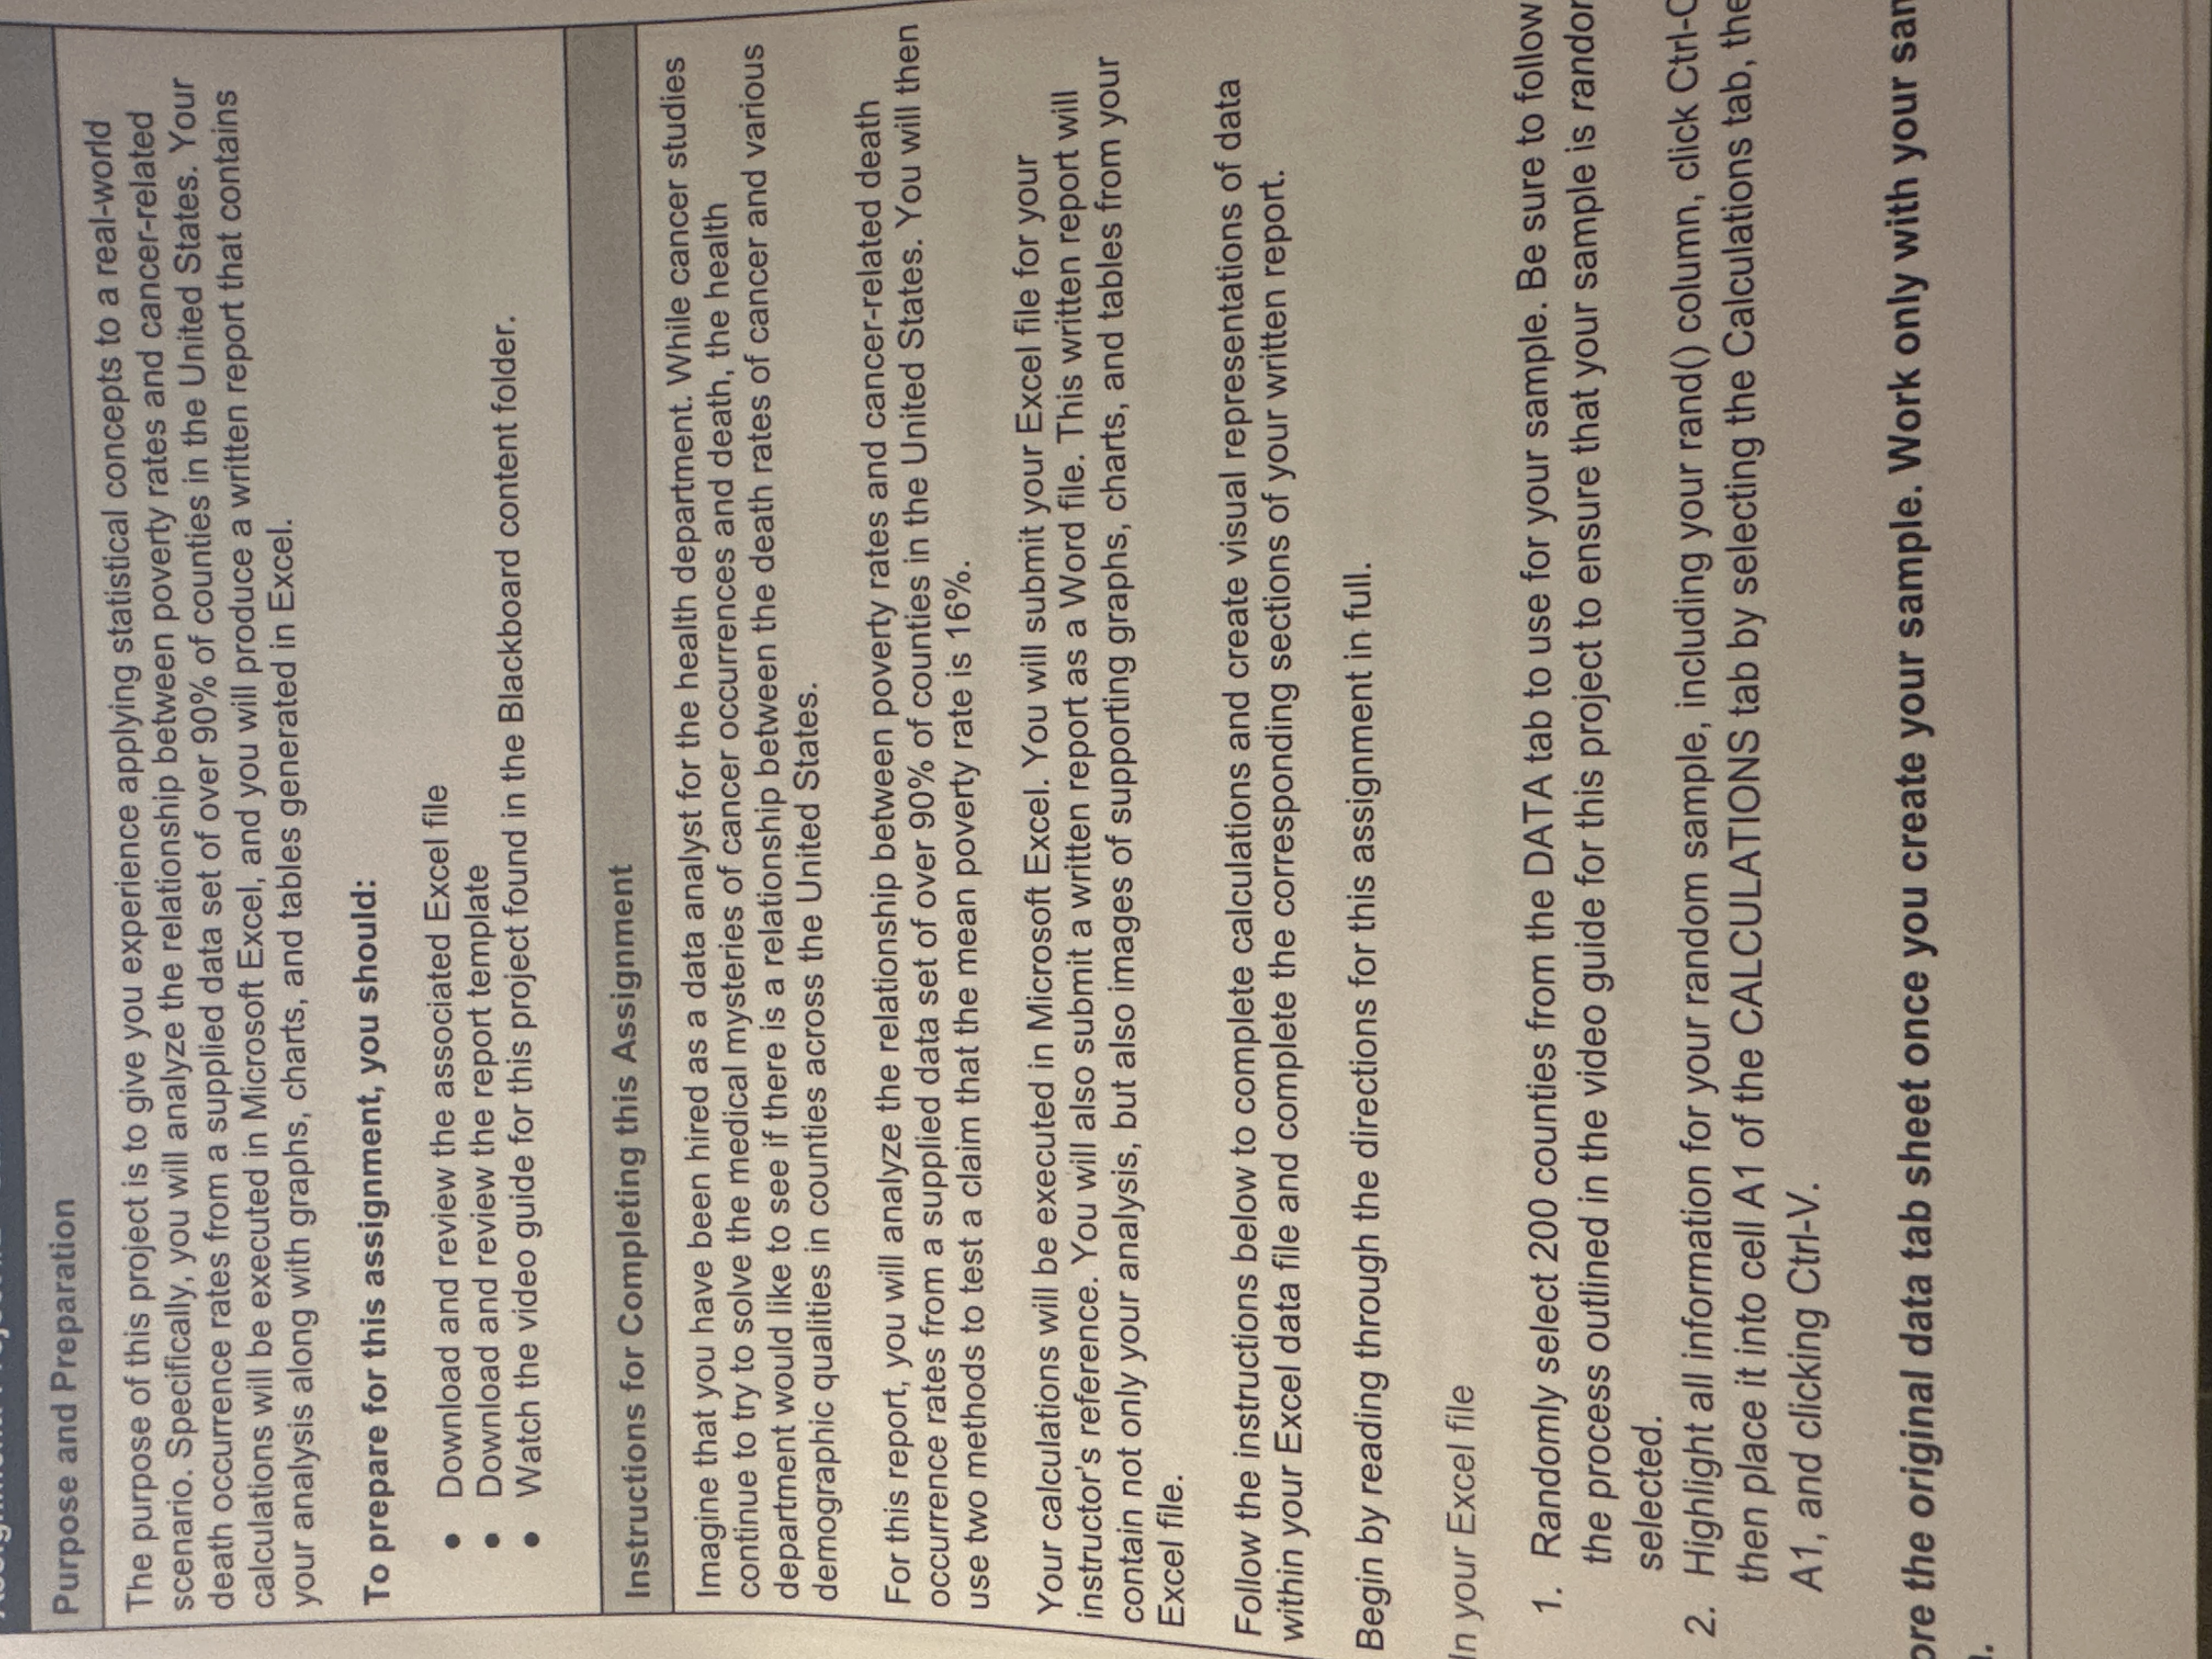
[Replace this text, including the brackets, with an introduction of the claim and the scenario of this hypothesis test. State your null and alternative hypothesis in sentence format. State your null and alternative hypothesis using proper mathematical format. State the Greek letter that will represent your population parameter. Define the meaning of your chosen parameter within this test. State your level of significance. Explain whether you've chosen to use a left-tailed, right-tailed, or two-tailed test and why.] Death Rate for Cancer Patients POVERTY & CANCER PATIENT DEATH RATE IN COUNTY RESIDENTS y=0.4306x+0.3403 R2=0.4495 0.600 0.500 0.400 0.300 0.200 0.100 0.000 0.000 0.050 0.100 0.150 0.200 0.250 0.300 0.350 0.400 0.450 Percent of County Residents in Poverty Cancer-Related Deaths Introduction The medical commmity's ongoing research on cancer is crucial in understanding its occurrence and death rates. The health department's interest in investigating the correlation between cancer death rates and various demographic characteristics of counties in the United States underscores the importance of this study. This report will delve into the relationship between poverty rates and cancer-related deaths using a comprehensive data set that covers over 90% of the counties in the country, providing a robust foundation for our analysis. This data set includes information on Residents in Poverty and the Death Rate of Cancer Patients collected from 200 counties and is representative of 2015. Two methods will be employed to determine the mean poverty rate of 16%. The following report presents a comprehensive analysis of the relationship between poverty rates and cancer-related death occurrence rates in the United States, supported by this rich data set and various graphs, charts, and tables. Histograms and Summary Statistics 200 County Residents in Poverty Min Q1 Med lan 03 Max Death Rate of 200 Cancer Patients 3 BOLLEYBOL 47,50 Wamber of Cancer Patient Death 504,0525] 52,05 County Residents In Poverty Death Rate of Cancer PL Mean Standard Dev. 0.1633 04106 0.1478 0.0402 0.0400 0.3091 0.1220 03805 0.1535 0.4079 0.2005 DA328 0.3850 05316 ARUN P Each vanable has undergone a thorough statistical analysis, revealing unique shape, center, and spread measures. In the case of the 200 County Residents in Poverty, the poverty rate is at a peak of 58% and then declines to 1%. The spike and decline could be attributed to various factors, such as the county's population in 2015, the age groups affected, and the unemployment rate prevailing in that county. This rigorous analysis ensures the reliability of our findings. The death rate of 200 cancer patients has fluctuated over time. It mitially rose from 4% to 44%, staying steady at 44%, then gradually declined to 11% before dropping to 1%. Several R S T Your sample shows that the mean percent of residents that live in poverty is 16.33% 0.1633 Mean Percent of County Residents in Poverty 0.1535 Median Percent of County Residents in Poverty 0.0626 Standard Deviation Percent of County Residents in Poverty 200 Sample Size Percent of County Residents in Poverty Min Percent of Residents in Poverty Q1for Percent of County Residents in Poverty Q2 for Percent of County Residents in Poverty Q3 for Percent of County Residents in Poverty Max Percent of Residents in Poverty X Z AA 0.4106 Mean Death Rate for Cancer Patients 0.4079 Median Death Rate for Cancer Patients 0.0402 Standard Deviation Death Rate for Cancer Patients 200 Sample Size Death Rate for Cancer Patients 0.30914 Min Death Rate for Cancer Patients 0.38081 Q1for Death Rate for Cancer Patients 0 40794 02 for Death Rate for Cancer Patients 0.43279 Q3 for Death Rate for Cancer Patients 0.53160 Max Death Rate for Cancer Patients Additional Information for Hypothesis Testing and Confidence intervals Type your level of significance as a decimal here in 217--> Type your confidence level as a decimal here in z18---> 0.670468 Correlation Coefficient 0 449527 Coefficient of Determination 0740194 Test Statistic: Z-score 0.229591 p-value Fight-tailed 0770409 p-value Left-tailed 0.459182 p-value Two-tailed 0.008672 Margin of Error 0.05 095 AB AC Your sample shows that the mean percent of individuals diagnosed with cancer that results in death is 41.06% Purpose and Preparation The purpose of this project is to give you experience applying statistical concepts to a real-world scenario. Specifically, you will analyze the relationship between poverty rates and cancer-related death occurrence rates from a supplied data set of over 90% of counties in the United States. Your calculations will be executed in Microsoft Excel, and you will produce a written report that contains your analysis along with graphs, charts, and tables generated in Excel. To prepare for this assignment, you should: Download and review the associated Excel file Download and review the report template Watch the video guide for this project found in the Blackboard content folder. Instructions for Completing this Assignment Imagine that you have been hired as a data analyst for the health department. While cancer studies continue to try to solve the medical mysteries of cancer occurrences and death, the health department would like to see if there is a relationship between the death rates of cancer and various demographic qualities in counties across the United States. For this report, you will analyze the relationship between poverty rates and cancer-related death occurrence rates from a supplied data set of over 90% of counties in the United States. You will then use two methods to test a claim that the mean poverty rate is 16%. Your calculations will be executed in Microsoft Excel. You will submit your Excel file for your instructor's reference. You will also submit a written report as a Word file. This written report will contain not only your analysis, but also images of supporting graphs, charts, and tables from your Excel file. Follow the instructions below to complete calculations and create visual representations of data within your Excel data file and complete the corresponding sections of your written report. Begin by reading through the directions for this assignment in full. In your Excel file 1. Randomly select 200 counties from the DATA tab to use for your sample. Be sure to follow the process outlined in the video guide for this project to ensure that your sample is randor selected. 2. Highlight all information for your random sample, including your rand() column, click Ctrl-C then place it into cell A1 of the CALCULATIONS tab by selecting the Calculations tab, the A1, and clicking Ctrl-V. pore the original data tab sheet once you create your sample. Work only with your sam
Step by Step Solution
There are 3 Steps involved in it
Hypothesis Testing for Cancer Death Rates and Poverty Levels Scenario and Claim The health departmen... View full answer

Get step-by-step solutions from verified subject matter experts