

Question: Reply to the discussion post NO AI When analyzing a histogram, there are several key factors to consider: the distribution symmetry, whether it is skewed
Reply to the discussion post NO AI
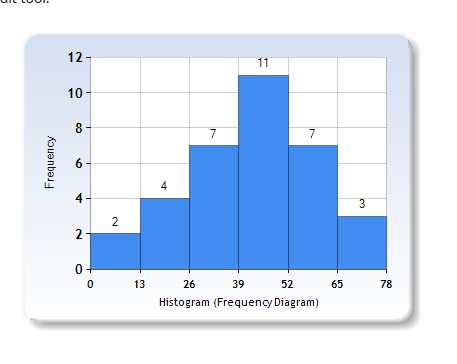
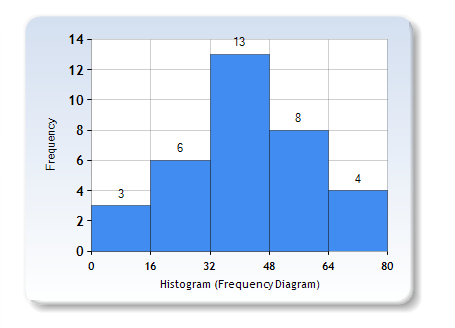
When analyzing a histogram, there are several key factors to consider: the distribution symmetry, whether it is skewed left or skewed right, and if it's unimodal or bimodal. For the initial histogram created by social science statistics, it mentions that the majority of scores are in the middle of the distribution and there are fewer scores at the extremes, in my opinion indicating a skewness to the left. This discussion also asks if this histogram is unimodal or bimodal and from what I can see it is unimodal because it has a distinct "peak".
Step by Step Solution
There are 3 Steps involved in it
1 Expert Approved Answer
Step: 1 Unlock

Question Has Been Solved by an Expert!
Get step-by-step solutions from verified subject matter experts
Step: 2 Unlock
Step: 3 Unlock