Question: Report Generation Complete DIS US Equity 96) Actions * 97) Export . 98) Settings 39) ADJ Walt Disney Co/The ASC 842 ? Periods 10 Annuals
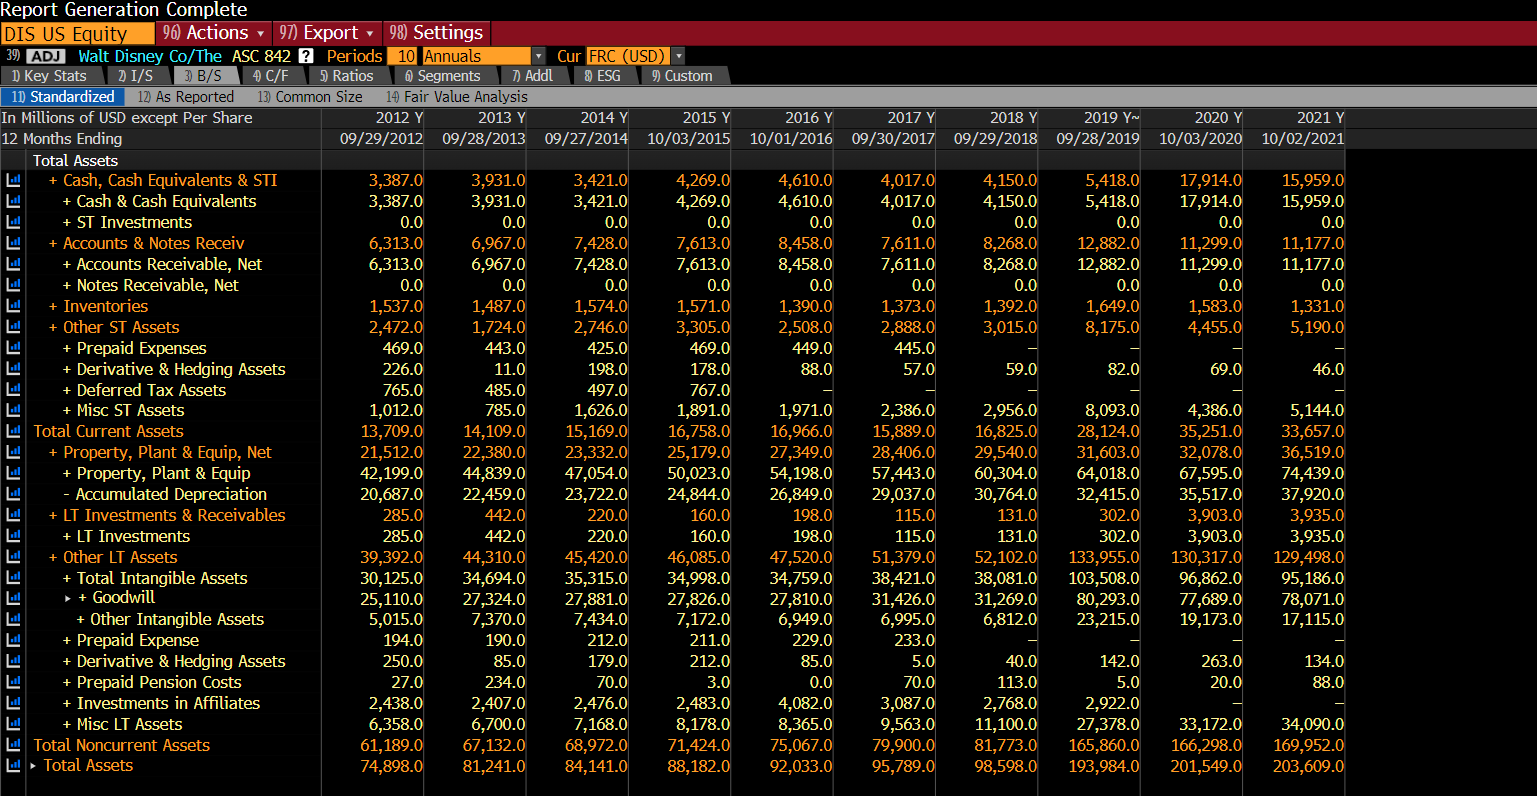
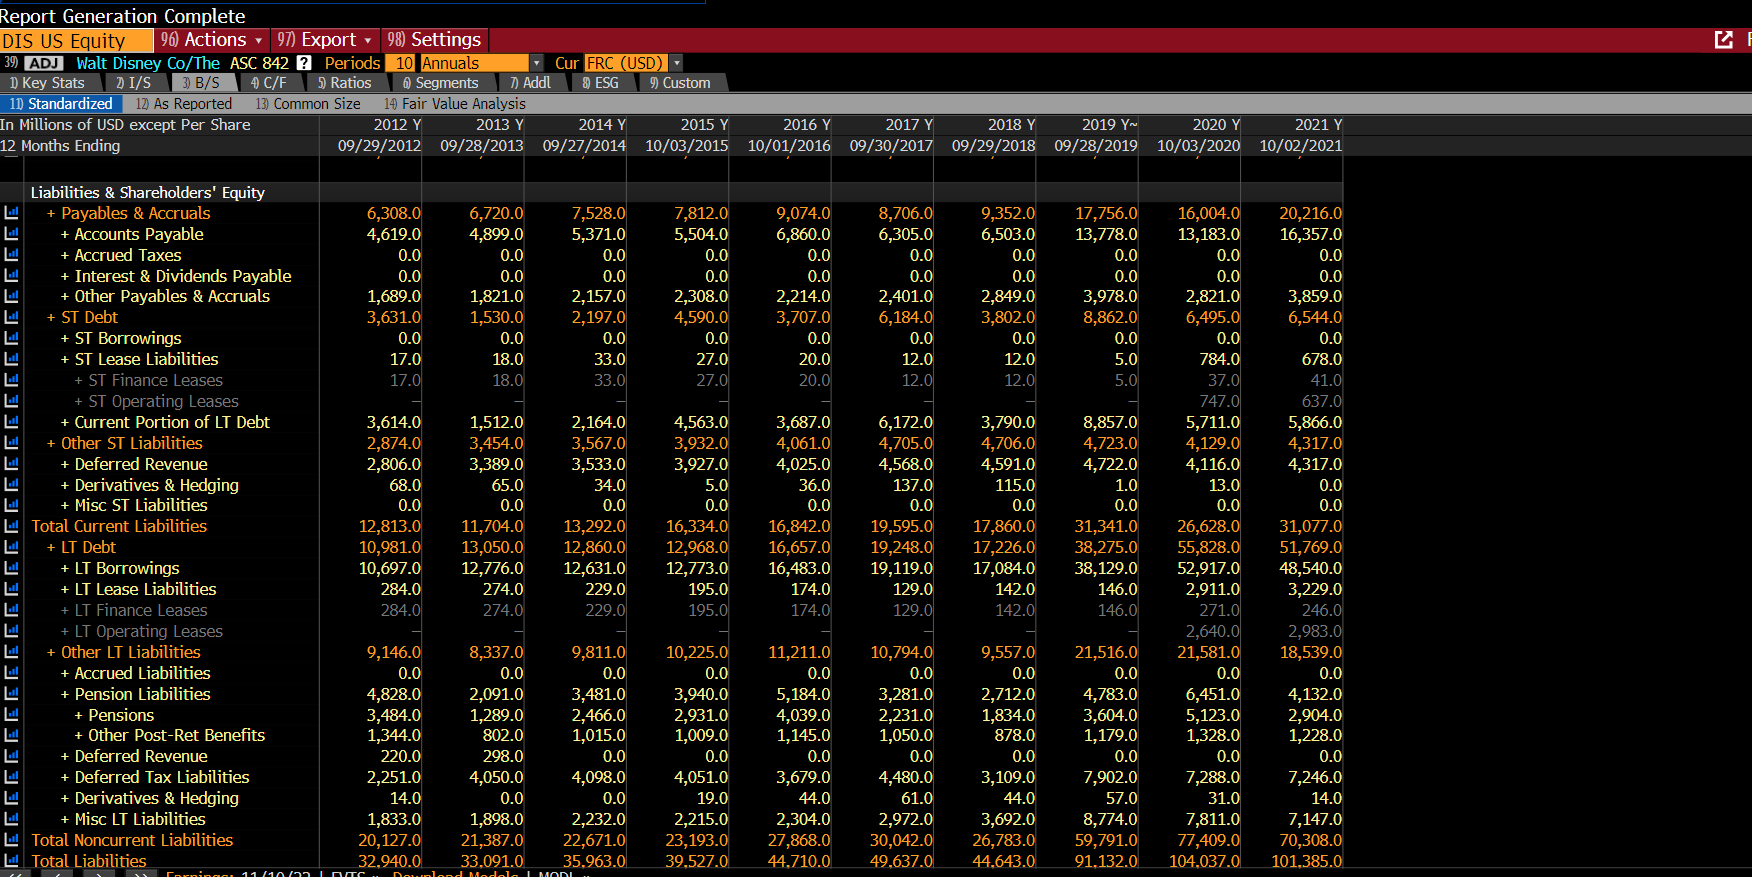
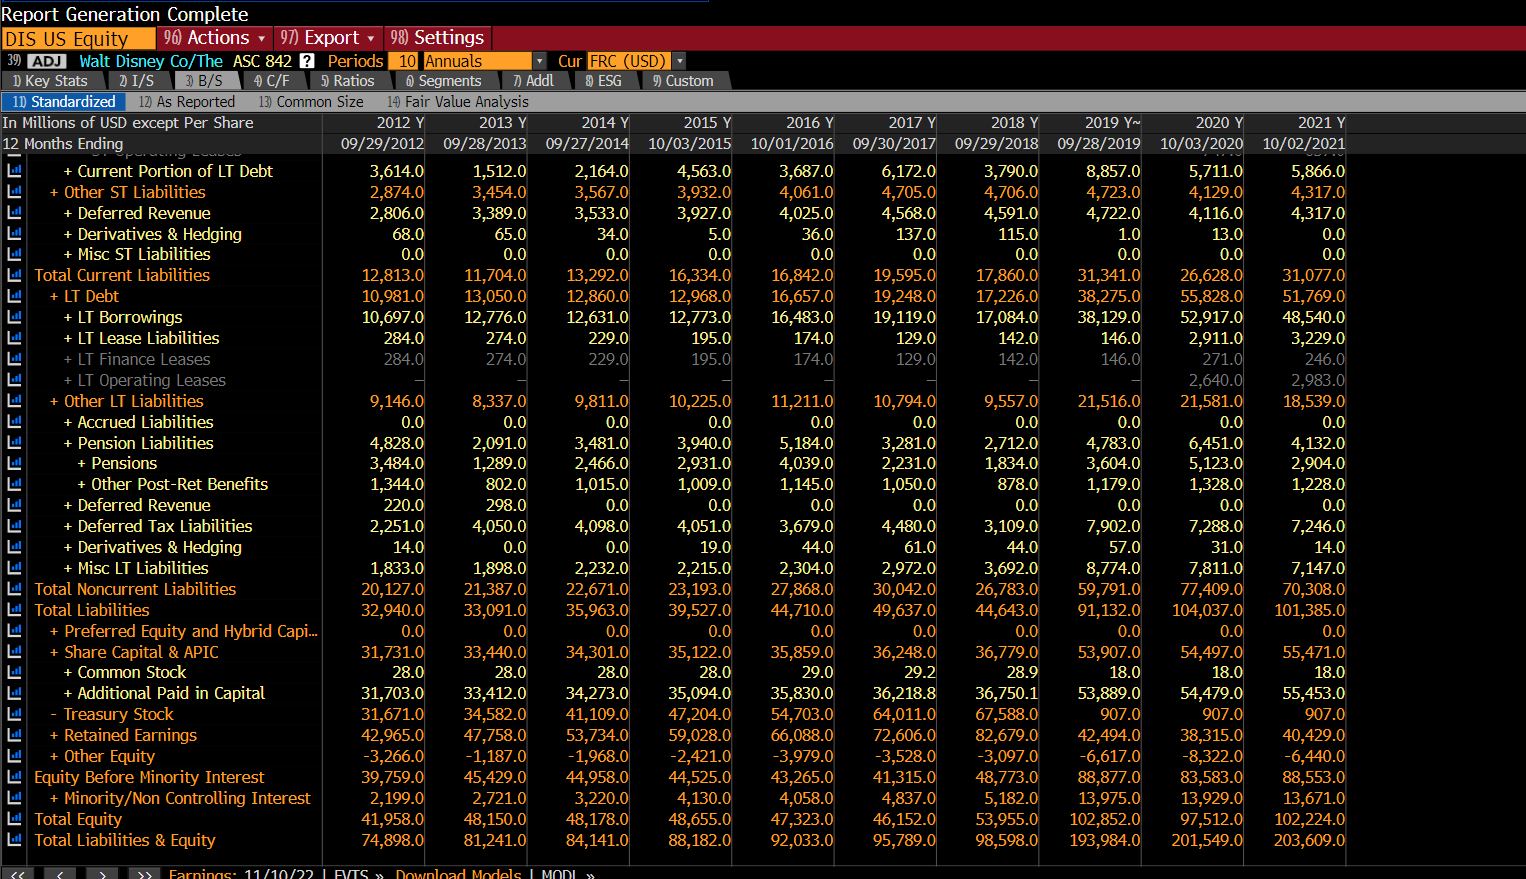
Report Generation Complete DIS US Equity 96) Actions * 97) Export . 98) Settings 39) ADJ Walt Disney Co/The ASC 842 ? Periods 10 Annuals Cur FRC (USD) 1) Key Stats 2 1/S 3) B/5 4 C/F 5 Ratios 6 Segments | 7) Addl 9 ESG 9) Custom 11) Standardized 12) As Reported 13) Common Size 10 Fair Value Analysis In Millions of USD except Per Share 2012 Y 2013 Y 2014 Y 2015 Y 2016 Y 2017 Y 2018 Y 2019 Y~ 2020 Y 2021 Y 12 Months Ending 09/29/2012 09/28/2013 09/27/2014 10/03/2015 10/01/2016 09/30/2017 09/29/2018 09/28/2019 10/03/2020 10/02/2021 Total Assets + Cash, Cash Equivalents & STI 3,387.0 3,931.0 3,421.0 4,269.0 4,610.0 4,017.0 4,150.0 5,418.0 17,914.0 15,959.0 + Cash & Cash Equivalents 3,387.0 3,931.0 3,421.0 4,269.0 4,610.0 4,017.0 4,150.0 5,418.0 17,914.0 15,959.0 + ST Investments 0.0 0.0 0.0 0.0 0.0 0.0 0.0 0.0 0.0 0.0 + Accounts & Notes Receiv 6,313.0 6,967.0 7,428.0 7,613.0 8,458.0 7,611.0 8,268.0 12,882.0 11,299.0 11,177.0 + Accounts Receivable, Net 6,313.0 6,967.0 7,428.0 7,613.0 8,458.0 7,611.0 8,268.0 12,882.0 11,299.0 11,177.0 + Notes Receivable, Net 0.0 0.0 0.0 0.0 0.0 0.0 0.0 0.0 0.0 0.0 Inventories 1,537.0 1,487.0 1,574.0 1,571.0 1,390.0 1,373.0 1,392.0 1,649.0 1,583.0 1,331.0 Other ST Assets 2,472.0 1,724.0 2,746.0 3,305.0 2,508.0 2,888.0 3,015.0 8,175.0 4,455.0 5,190.0 + Prepaid Expenses 469.0 443.0 425.0 469.0 449.0 445.0 + Derivative & Hedging Assets 226.0 11.0 198.0 178.0 88.0 57.0 59.0 82.0 69.0 46.0 + Deferred Tax Assets 765.0 485.0 497.0 767.0 + Misc ST Assets 1,012.0 785.0 1,626.0 1,891.0 1,971.0 2,386.0 2,956.0 8,093.0 4,386.0 5,144.0 Total Current Assets 13,709.0 14,109.0 15,169.0 16,758.0 16,966.0 15,889.0 16,825.0 28,124.0 35,251.0 33,657.0 + Property, Plant & Equip, Net 21,512.0 22,380.0 23,332.0 25,179.0 27,349.0 28,406.0 29,540.0 31,603.0 32,078.0 36,519.0 + Property, Plant & Equip 42,199.0 44,839.0 47,054.0 50,023.0 54,198.0 57,443.0 60,304.0 64,018.0 67,595.0 74,439.0 - Accumulated Depreciation 20,687.0 22,459.0 23,722.0 24,844.0 26,849.0 29,037.0 30,764.0 32,415.0 35,517.0 37,920.0 + LT Investments & Receivables 285.0 442.0 220.0 160.0 198.0 115.0 131.0 302.0 3,903.0 3,935.0 + LT Investments 285.0 442.0 220.0 160.0 198.0 115.0 131.0 302.0 3,903.0 3,935.0 Other LT Assets 39,392.0 44,310.0 45,420.0 46,085.0 47,520.0 51,379.0 52,102.0 133,955.0 130,317.0 129,498.0 + Total Intangible Assets 30,125.0 34,694.0 35,315.0 34,998.0 34,759.0 38,421.0 38,081.0 103,508.0 96,862.0 95, 186.0 > + Goodwill 25,110.0 27,324.0 27,881.0 27,826.0 27,810.0 31,426.0 31,269.0 80,293.0 77,689.0 78,071.0 + Other Intangible Assets 5,015.0 7,370.0 7,434.0 7,172.0 6,949.0 6,995.0 6,812.0 23,215.0 19,173.0 17,115.0 + Prepaid Expense 194.0 190.0 212.0 211.0 229.0 233.0 Derivative & Hedging Assets 250.0 85.0 179.0 212.0 85.0 5.0 40.0 142.0 263.0 134.0 + Prepaid Pension Costs 27.0 234.0 70.0 3.0 0.0 70.0 113.0 5.0 20.0 88.0 + Investments in Affiliates 2,438.0 2,407.0 2,476.0 2,483.0 4,082.0 3,087.0 2,768.0 2,922.0 + Misc LT Assets 6,358.0 6,700.0 7,168.0 8,178.0 8,365.0 9,563.0 11,100.0 27,378.0 33,172.0 34,090.0 Total Noncurrent Assets 61, 189.0 67,132.0 68,972.0 71,424.0 75,067.0 79,900.0 81,773.0 165,860.0 166,298.0 169,952.0 Laid > Total Assets 74,898.0 81,241.0 84,141.0 88,182.0 92,033.0 95,789.0 98,598.0 193,984.0 201,549.0 203,609.0Report Generation Complete DIS US Equity 96) Actions . |97) Export . 98) Settings 39) ADJ Walt Disney Co/The ASC 842 ? Periods 10 Annuals Cur FRC (USD) 1) Key Stats | 2 I/S 3) B/S 4 C/F 5) Ratios 6 Segments D Addl & ESG 9) Custom 11) Standardized |12) As Reported 13) Common Size 14 Fair Value Analysis in Millions of USD except Per Share 2012 Y 2013 Y 2014 Y 2015 Y 2016 Y 2017 Y 2018 Y 2019 Y~ 2020 Y 2021 Y 12 Months Ending 09/29/2012 09/28/2013 09/27/2014 10/03/2015 10/01/2016 09/30/2017 09/29/2018 09/28/2019 10/03/2020 10/02/2021 Liabilities & Shareholders' Equity + Payables & Accruals 6,308.0 6,720.0 7,528.0 7,812.0 9,074.0 8,706.0 9,352.0 17,756.0 16,004.0 20,216.0 + Accounts Payable 4,619.0 4,899.0 5,371.0 5,504.0 6,860.0 6,305.0 6,503.0 13,778.0 13,183.0 16,357.0 + Accrued Taxes 0.0 0.0 0.0 0.0 0.0 0.0 0.0 0.0 0.0 0.0 + Interest & Dividends Payable 0.0 0.0 0.0 0.0 0.0 0.0 0.0 0.0 0.0 0.0 + Other Payables & Accruals 1,689.0 1,821.0 2,157.0 2,308.0 2,214.0 2,401.0 2,849.0 3,978.0 2,821.0 3,859.0 ST Debt 3,631.0 1,530.0 2,197.0 4,590.0 3,707.0 6,184.0 3,802.0 8,862.0 6,495.0 6,544.0 + ST Borrowings 0.0 0.0 0.0 0.0 0.0 0.0 0.0 0.0 0.0 0.0 ST Lease Liabilities 17.0 18.0 33.0 27.0 20.0 12.0 12.0 5.0 784.0 678.0 + ST Finance Leases 17.0 18.0 33.0 27.0 20.0 12.0 12.0 5.0 37.0 41.0 + ST Operating Leases 747.0 637.0 + Current Portion of LT Debt 3,614.0 1,512.0 2,164.0 4,563.0 3,687.0 6,172.0 3,790.0 8,857.0 5,711.0 5,866.0 + Other ST Liabilities 2,874.0 3,454.0 3,567.0 3,932.0 4,061.0 4,705.0 4,706.0 4,723.0 4,129.0 4,317.0 + Deferred Revenue 2,806.0 3,389.0 3,533.0 3,927.0 4,025.0 4,568.0 4,591.0 4,722.0 4,116.0 4,317.0 + Derivatives & Hedging 68.0 65.0 34.0 5.0 36.0 137.0 115.0 1.0 13.0 0.0 + Misc ST Liabilities 0.0 0.0 0.0 0.0 0.0 0.0 0.0 0.0 0.0 0.0 Total Current Liabilities 12,813.0 11,704.0 13,292.0 16,334.0 16,842.0 19,595.0 17,860.0 31,341.0 26,628.0 31,077.0 + LT Debt 10,981.0 13,050.0 12,860.0 12,968.0 16,657.0 19,248.0 17,226.0 38,275.0 55,828.0 51,769.0 + LT Borrowings 10,697.0 12,776.0 12,631.0 12,773.0 16,483.0 19,119.0 17,084.0 38,129.0 52,917.0 48,540.0 + LT Lease Liabilities 284.0 274.0 229.0 195.0 174.0 129.0 142.0 146.0 2,911.0 3,229.0 + LT Finance Leases 284.0 274.0 229.0 195.0 174.0 129.0 142.0 146.0 271.0 246.0 + LT Operating Leases 2,640.0 2,983.0 Other LT Liabilities 9,146.0 8,337.0 9,811.0 10,225.0 11,211.0 10,794.0 9,557.0 21,516.0 21,581.0 18,539.0 + Accrued Liabilities 0.0 0.0 0.0 0.0 0.0 0.0 0.0 0.0 0.0 0.0 + Pension Liabilities 4,828.0 2,091.0 3,481.0 3,940.0 5,184.0 3,281.0 2,712.0 4,783.0 6,451.0 4,132.0 + Pensions 3,484.0 1,289.0 2,466.0 2,931.0 4,039.0 2,231.0 1,834.0 3,604.0 5,123.0 2,904.0 + Other Post-Ret Benefits 1,344.0 802.0 1,015.0 1,009.0 1,145.0 1,050.0 878.0 1,179.0 1,328.0 1,228.0 + Deferred Revenue 220.0 298.0 0.0 0.0 0.0 0.0 0.0 0.0 0.0 0.0 + Deferred Tax Liabilities 2,251.0 4,050.0 4,098.0 4,051.0 3,679.0 4,480.0 3,109.0 7,902.0 7,288.0 7,246.0 + Derivatives & Hedging 14.0 0.0 0.0 19.0 44.0 61.0 44.0 57.0 31.0 14.0 + Misc LT Liabilities 1,833.0 1,898.0 2,232.0 2,215.0 2,304.0 2,972.0 3,692.0 8,774.0 7,811.0 7,147.0 Total Noncurrent Liabilities 20,127.0 21,387.0 22,671.0 23,193.0 27,868.0 30,042.0 26,783.0 59,791.0 77,409.0 70,308.0 Total Liabilities 32,940.0 33.091.0 35,963.0 39.527.0 44.710.0 49.637.0 44.643.0 91.132.0 104.037.0 101.385.0\f