

Question: Report & Interpret the results using SPSS (Please attach screenshots of SPSS steps thanks) The following are the ages (years) and systolic blood pressures of
Report & Interpret the results using SPSS (Please attach screenshots of SPSS steps thanks)
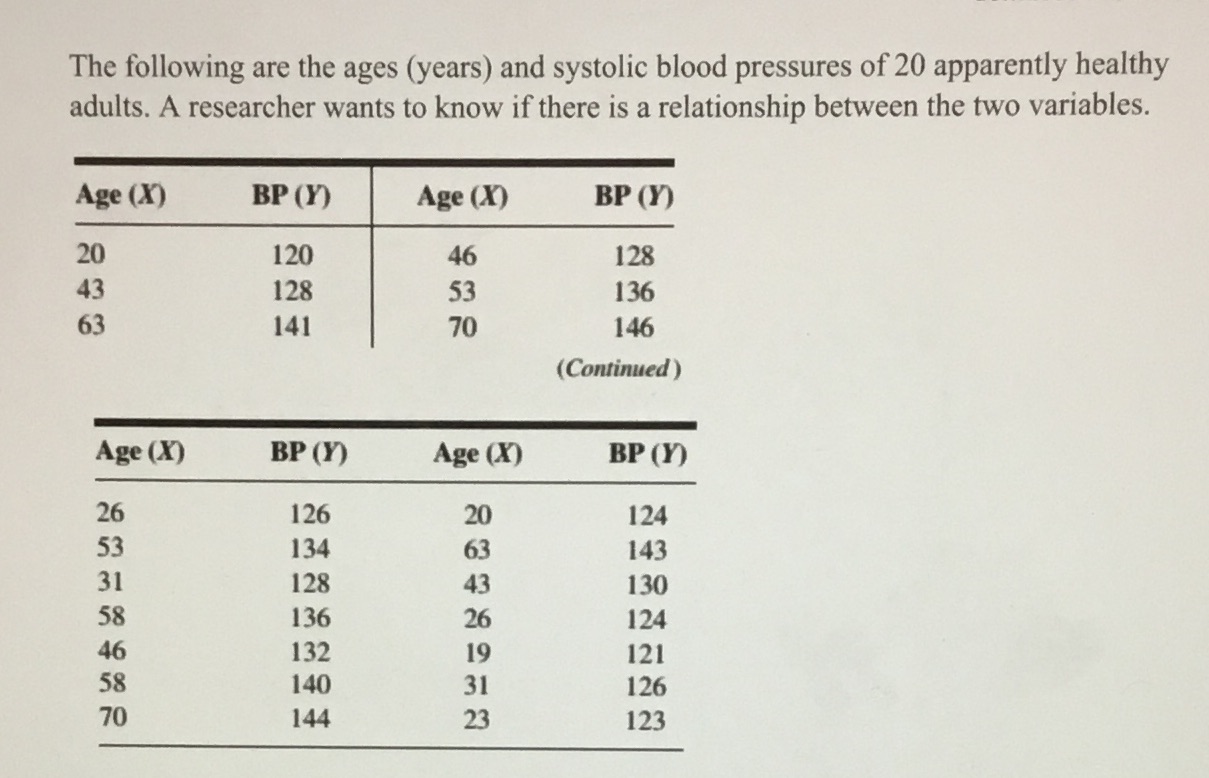
The following are the ages (years) and systolic blood pressures of 20 apparently healthy adults. A researcher wants to know if there is a relationship between the two variables. Age (X) BP (Y) Age (X) BP (Y) 20 120 46 128 43 128 53 136 63 141 70 146 (Continued) Age (X) BP (Y) Age (X) BP (Y) 26 126 20 124 53 134 63 143 31 128 43 130 58 136 26 124 46 132 19 121 58 140 31 126 70 144 23 123
Step by Step Solution
There are 3 Steps involved in it
1 Expert Approved Answer
Step: 1 Unlock

Question Has Been Solved by an Expert!
Get step-by-step solutions from verified subject matter experts
Step: 2 Unlock
Step: 3 Unlock