

Question: Reporting Measurements 12 Item Value 20 14 A. Input this information into two columns in an Excel spreadsheet. Then, create a line graph using the
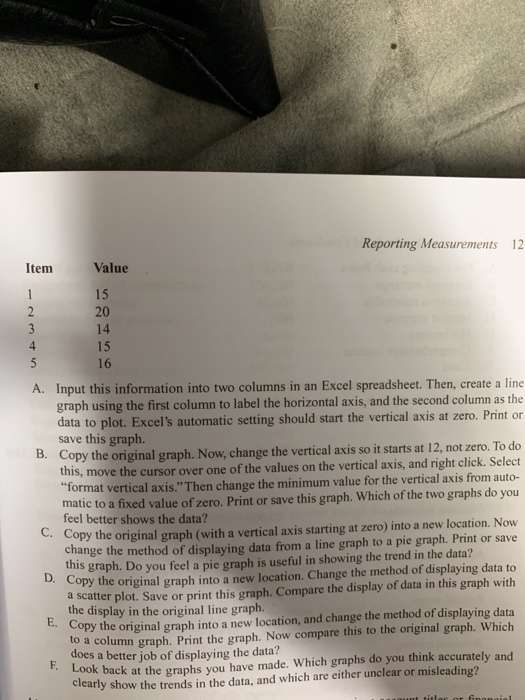
Reporting Measurements 12 Item Value 20 14 A. Input this information into two columns in an Excel spreadsheet. Then, create a line graph using the first column to label the horizontal axis, and the second column as the data to plot. Excel's automatic setting should start the vertical axis at zero. Print or save this graph. Copy the original graph this, move the cursor B. . Now, change the vertical axis so it starts at 12, not zero. To do over one of the values on the vertical axis, and right click. Select format vertical axis." Then change the minimum value for the vertical axis from auto- matic to a fixed value of zero. Print or save this graph. Which of the two graphs do you feel better shows the data? opy the original graph (with a vertical axis starting at zero) into a new location. Now change the method of displaying data from a line graph to a pie graph. Print or save this graph. Do you feel a pie graph is useful in showing the trend in the data? Copy the original graph into a new location. Change the method of displaying data to d scatter plot. Save or print this graph. Compare the display of data in this graph with the display in the original line graph. Copy the original graph into a new location, and change the method of displaying data o a column graph. Print the graph. Now compare this to the original graph. Which does a better job of displaying the data? Look back at the graphs you have made. Which graphs do you think accurately and clearly show the trends in the data, and which are either unclear or misleading? E. c
Step by Step Solution
There are 3 Steps involved in it

Get step-by-step solutions from verified subject matter experts