

Question: *****Reposting because I am still having issues and cannot produce a graph****** I posted this previously and some of it was helpful, but I am
*****Reposting because I am still having issues and cannot produce a graph******
I posted this previously and some of it was helpful, but I am still having errors. The IDE I am using is Pycharm and the plotting package I am using is matplotlib. I will post the solution from the previous post and the issues I am still running into!
AS ALWAYS, ALL HELP IS APPRECIATED THANK YOU!!!!!
SOLUTION: IN PYTHON
import csv import datetime import matplotlib.pyplot as plt with open('sr_ss_clean.csv') as temp_file: sunrise = [] sunset = [] reader = csv.reader(temp_file) next(reader) for row in reader: sunrise.append(float(row[1])) sunset.append(float(row[2])) start_date = datetime.date(2022, 1, 1) end_date = datetime.date(2022, 12, 31) delta = datetime.timedelta(days=1) date = [] while start_date
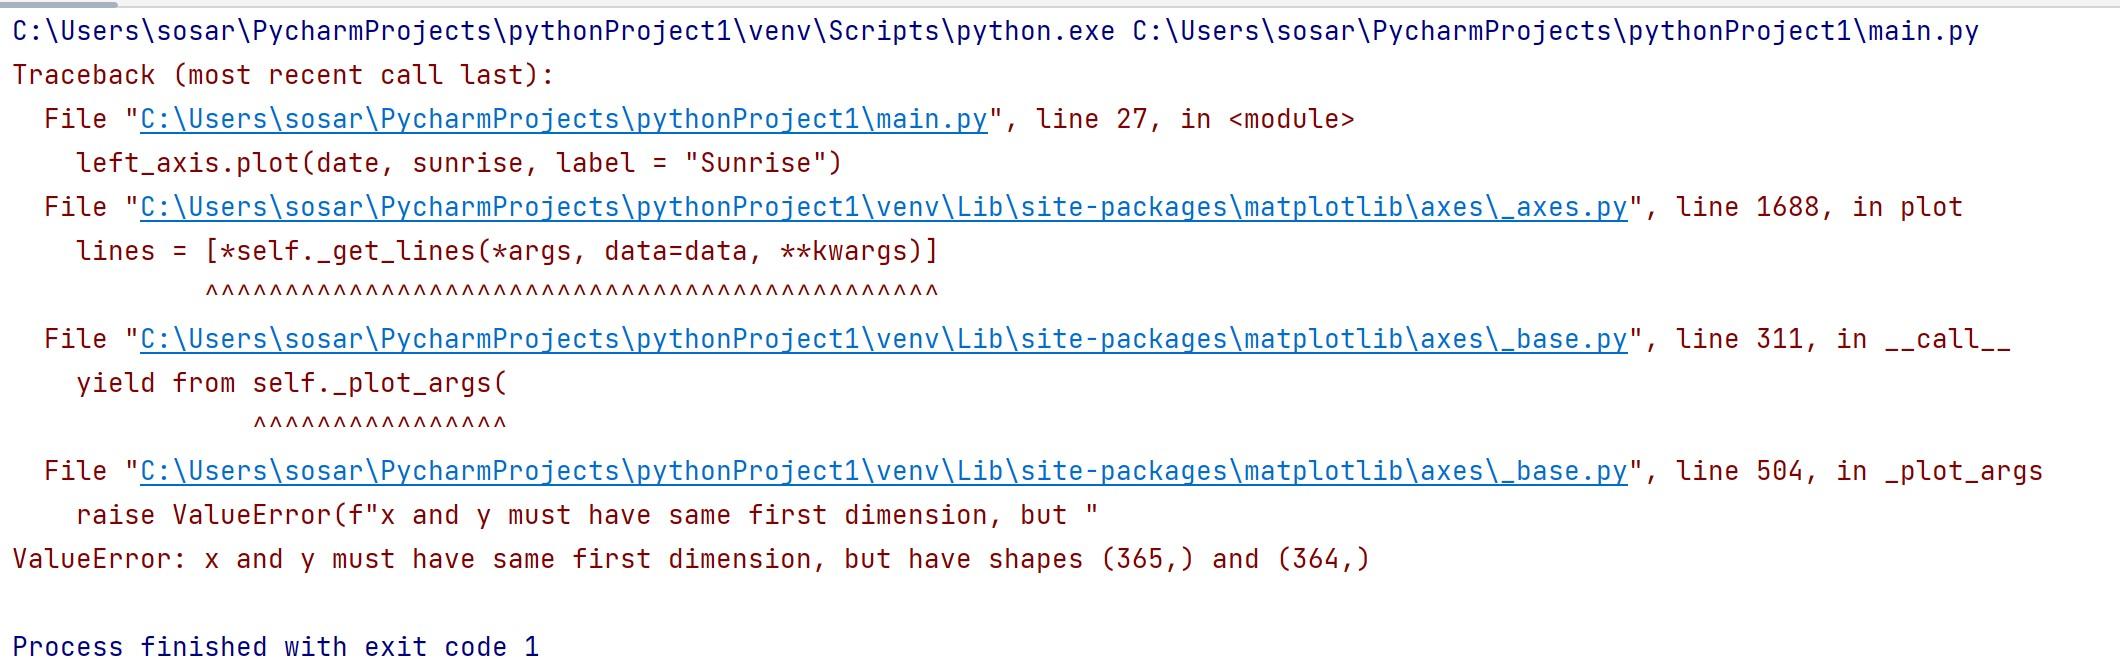
ERRORS I AM GETTING
ROUGHLY WHAT I AM TRYING TO GET MY GRAPH TO LOOK LIKE. IT DOES NOT HAVE TO BE EXACT, BUT IT NEEDS TO HAVE THE SAME CONCEPT AND LOGIC
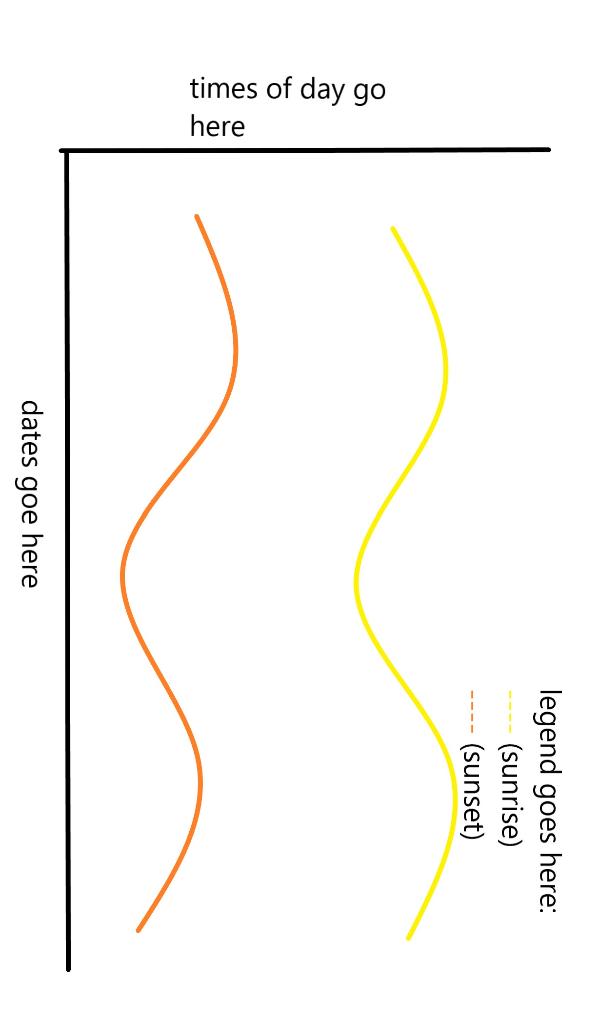
dates goe here Step by Step Solution
There are 3 Steps involved in it
1 Expert Approved Answer
Step: 1 Unlock

Question Has Been Solved by an Expert!
Get step-by-step solutions from verified subject matter experts
Step: 2 Unlock
Step: 3 Unlock