

Question: Reposting with the data needed to solve problem. Please help! And please show formulas! = Chegg Books Study Writing Flashcards Math Solver Internships home /
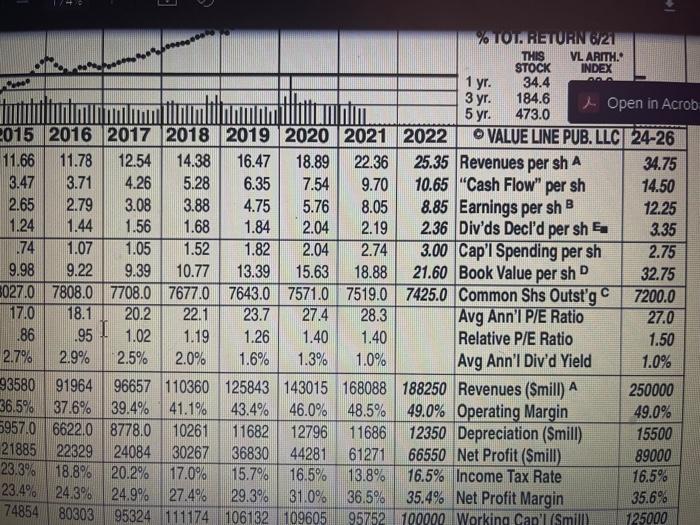
= Chegg Books Study Writing Flashcards Math Solver Internships home / study / business / finance / finance questions and answers / calculate for microsoft stock 20. what is the estimated growth Question: Calculate for Microsoft Stock 20. What is the estimated Calculate for Microsoft Stock 20. What is the estimated growth rate of dividends from 2018-2020 to 2024-20262 (Find at value line survey, valueline.com) 21. What are the dividends for the years 2021, 2022 and 2024-2026? (Find at value line survey)? 22 Using the dividend per share for 2021, 2022 and assuming that the dividend in 2023= dividend in 2024 +2026 and dividends have a constant growth starting in the year 2023. Estimate the value of your stocks on January 4th, 2021. You can use the required rate of return computed in question 18 for your calculations. Required rate =9.869 (Hint: use the steps for a stock with nonconstant growth). Expert Answer o % TOT. RETURN 621 THIS VL ARITH. STOCK INDEX 1 yr. 34.4 3 yr. 184.6 Open in Acrob 5 yr. 473.0 2015 2016 2017 2018 2019 2020 2021 2022 VALUE LINE PUB. LLC24-26 11.66 11.78 12.54 14.38 16.47 18.89 22.36 25.35 Revenues per sh A 34.75 3.47 3.71 4.26 5.28 6.35 7.54 9.70 10.65 "Cash Flow" per sh 14.50 2.65 2.79 3.08 3.88 4.75 5.76 8.05 8.85 Earnings per sh 12.25 1.24 1.44 1.56 1.68 1.84 2.04 2.19 2.36 Div'ds Decl'd per sh 3.35 .74 1.07 1.05 1.52 1.82 2.04 2.74 3.00 Cap'l Spending per sh 2.75 9.98 9.22 9.39 10.77 13.39 15.63 18.88 21.60 Book Value per sh 32.75 5027.0 7808.07708.07677.0 7643.0 7571.0 7519.0 7425.0 Common Shs Outst'g 7200.0 17.0 18.1 20.2 22.1 23.7 27.4 28.3 Avg Ann'i P/E Ratio 27.0 .86 .95 1.02 1.19 1.26 1.40 1.40 Relative P/E Ratio 1.50 2.7% 2.9% 2.5% 2.0% 1.6% 1.3% 1.0% Avg Ann'l Div'd Yield 1.0% 93580 91964 96657 110360125843 143015168088 188250 Revenues (Smill) A 250000 36.5% 37.6% 39.4% 41.1% 43.4% 46.0% 48.5% 49.0% Operating Margin 49.0% 5957.0 6622.0 8778.0 10261 11682 12796 11686 12350 Depreciation (Smill) 15500 21885 22329 24084 30267 36830 44281 61271 66550 Net Profit (Smill) 89000 23.3% 18.8% 20.2% 17.0% 15.7% 16,5% 13.8% 16.5% Income Tax Rate 16.5% 23.4% 24.3% 24.9% 27.4% 29.3% 31.0% 36.5% 35.4% Net Profit Margin 35.6% 74854 80303 95324 111174 106132 109605 95752 100000 Working Cap' (Smill) 125000
Step by Step Solution
There are 3 Steps involved in it

Get step-by-step solutions from verified subject matter experts