Question: Representations of Rational Function Please present a full solution/explanation. (2 ACTIVITIES) Application x- 1 Represent the rational function given by f(x) = r + 1
Representations of Rational Function
Please present a full solution/explanation. (2 ACTIVITIES)
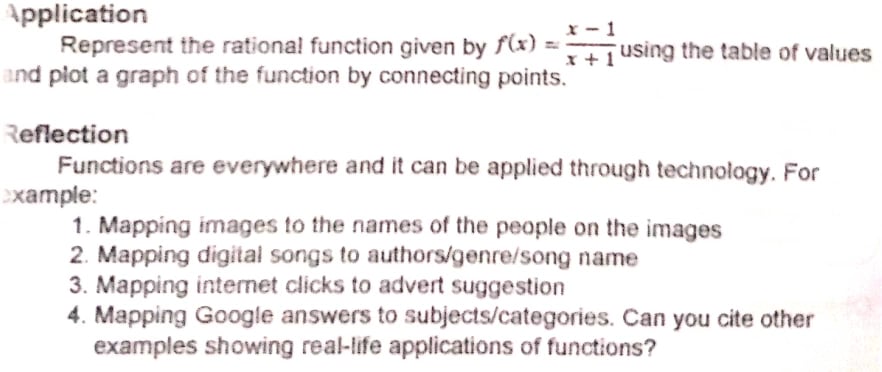
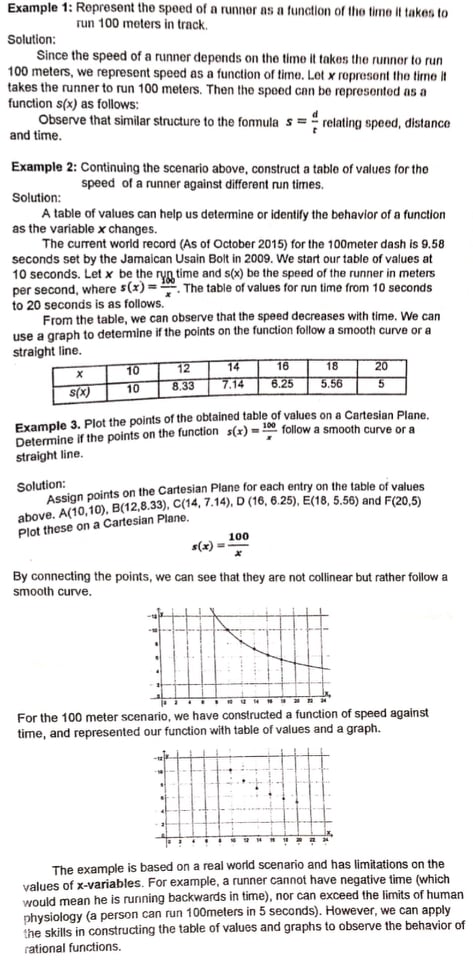
Application x- 1 Represent the rational function given by f(x) = r + 1 using the table of values and plot a graph of the function by connecting points. Reflection Functions are everywhere and it can be applied through technology. For xample: 1. Mapping images to the names of the people on the images 2. Mapping digital songs to authors/genre/song name 3. Mapping internet clicks to advert suggestion 4. Mapping Google answers to subjects/categories. Can you cite other examples showing real-life applications of functions?Example 1: Represent the speed of a runner as a function of the time it takes to run 100 meters in track. Solution: Since the speed of a runner depends on the time it takes the runner to run 100 meters, we represent speed as a function of time. Let x represent the time It takes the runner to run 100 meters. Then the speed can be represented as a function s(x) as follows: Observe that similar structure to the formula s = = relating speed, distance and time. Example 2: Continuing the scenario above, construct a table of values for the speed of a runner against different run times. Solution: A table of values can help us determine or identify the behavior of a function as the variable x changes. The current world record (As of October 2015) for the 100meter dash is 9.58 seconds set by the Jamaican Usain Bolt in 2009. We start our table of values at 10 seconds. Let x be the ryn time and s(x) be the speed of the runner in meters per second, where s(x)= . The table of values for run time from 10 seconds to 20 seconds is as follows. From the table, we can observe that the speed decreases with time. We can use a graph to determine if the points on the function follow a smooth curve or a straight line. X 10 12 14 18 18 20 s(X) 10 8,33 7.14 6.25 5.56 5 Example 3. Plot the points of the obtained table of values on a Cartesian Plane. Determine if the points on the function s(x) = = follow a smooth curve or a straight line. Solution: Assign points on the Cartesian Plane for each entry on the table of values above. A(10,10), B(12,8.33), C(14, 7.14), D (16, 6.25), E(18, 5.56) and F(20,5) Plot these on a Cartesian Plane. 100 s(x) = By connecting the points, we can see that they are not collinear but rather follow a smooth curve. For the 100 meter scenario, we have constructed a function of speed against time, and represented our function with table of values and a graph. The example is based on a real world scenario and has limitations on the values of x-variables. For example, a runner cannot have negative time (which would mean he is running backwards in time), nor can exceed the limits of human physiology (a person can run 100meters in 5 seconds). However, we can apply the skills in constructing the table of values and graphs to observe the behavior of rational functions
Step by Step Solution
There are 3 Steps involved in it
1 Expert Approved Answer
Step: 1 Unlock
Question Has Been Solved by an Expert!
Get step-by-step solutions from verified subject matter experts
Step: 2 Unlock
Step: 3 Unlock
Students Have Also Explored These Related Mathematics Questions!