

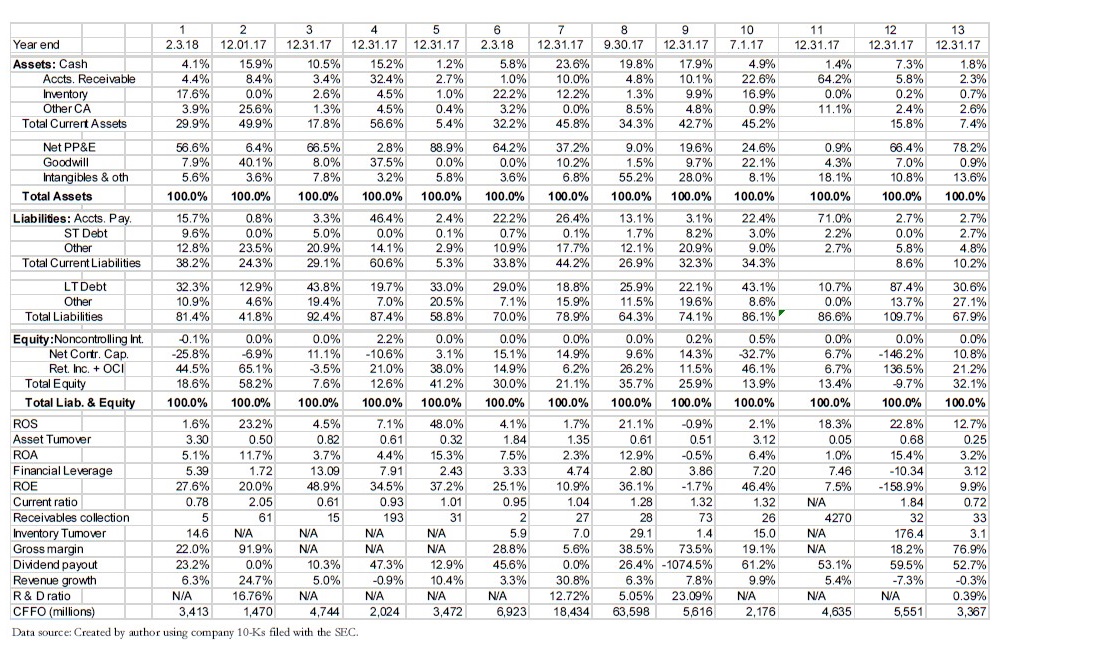
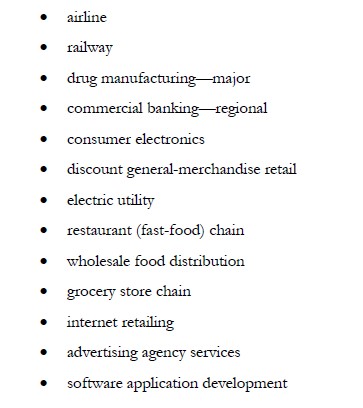
Requesting input/assistance in matching the industries to the ratios given the financial data Ratio Industry Reasoning 1.
Fantastic news! We've Found the answer you've been seeking!
Question:
Requesting input/assistance in matching the industries to the ratios given the financial data
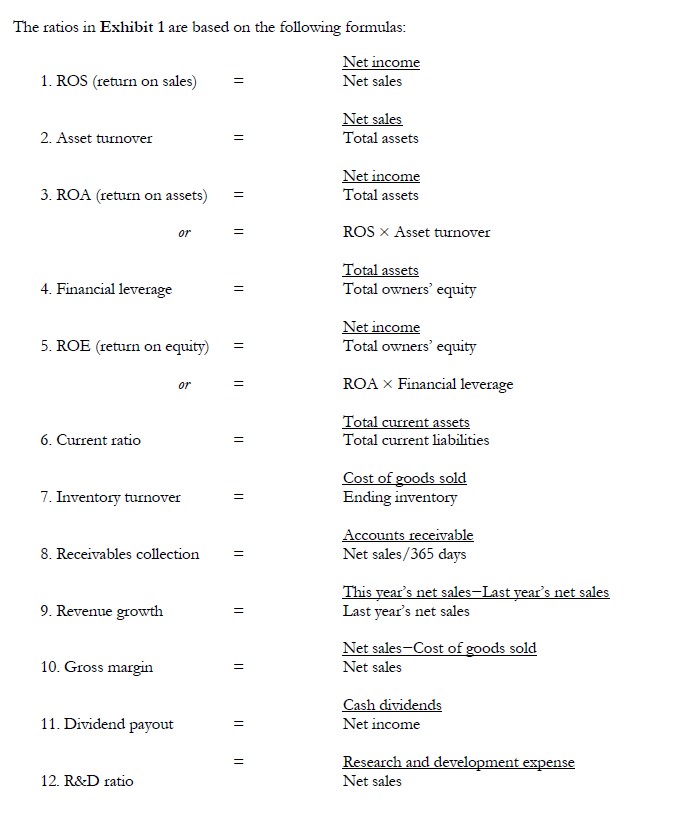
Ratio | Industry | Reasoning |
| 1. Return on sales | ||
| 2. Asset turnover | ||
| 3. Return on assets | ||
| 4. Financial leverage | ||
| 5. Return on equity | ||
| 6. Current ratio | ||
| 7. Inventory turnover | ||
| 8. Receivables collection | ||
| 9. Revenue Growth | ||
| 10. Gross Margin | ||
| 11. Dividend payout | ||
| 12. R&D ratio |
Expert Answer:
Lets analyze the given financial ratios for each industry 1 Return on Sales ROS Highest Drug manufac... View the full answer

Related Book For 
International Financial Reporting and Analysis
ISBN: 978-1408075012
5th edition
Authors: David Alexander, Anne Britton, Ann Jorissen
Posted Date:
